Final Project: Data Threads
Data Threads explores the border between the digital and physical worlds, by finding ways to represent personal communication data.
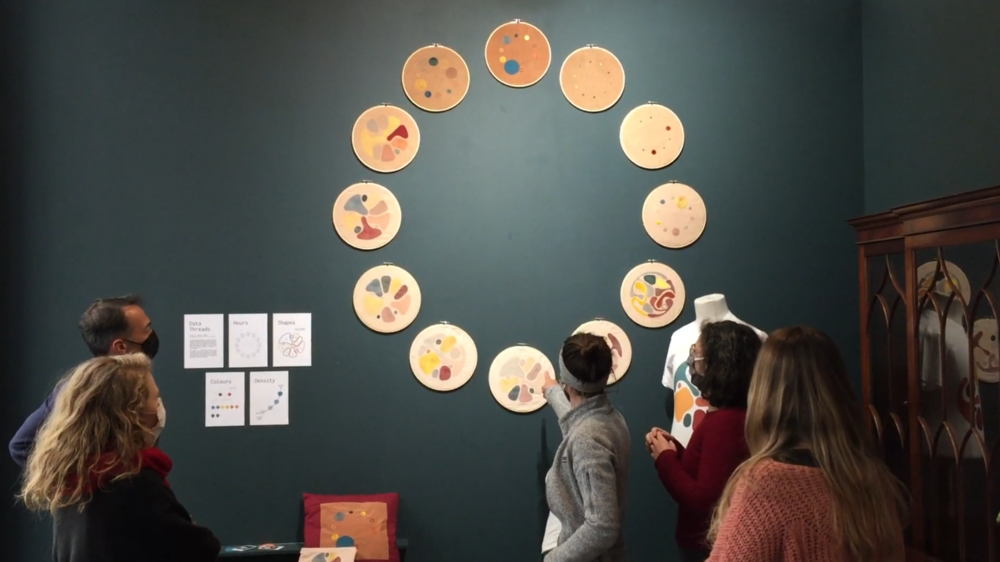
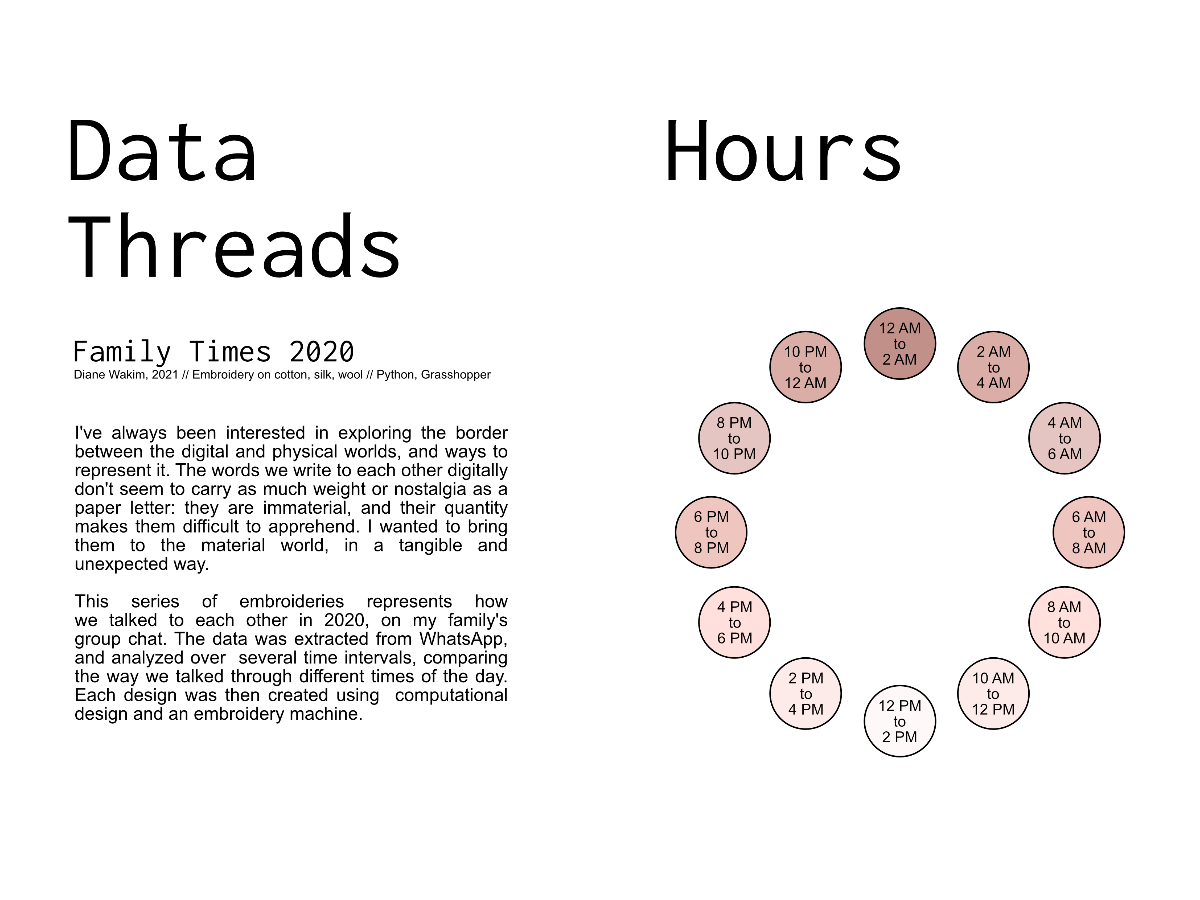
Family Times 2020
An exhibition currently held at Le Textile Lab.
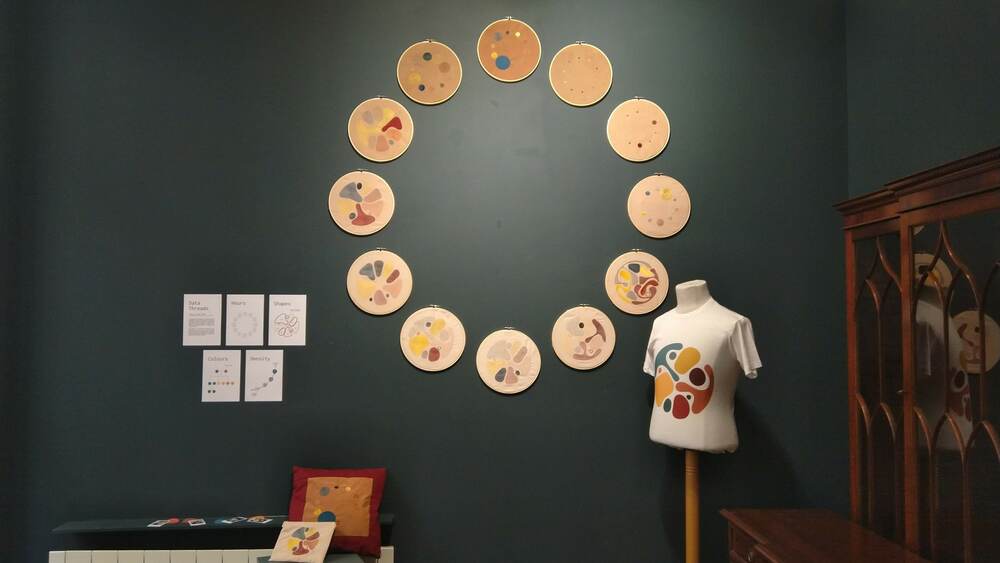
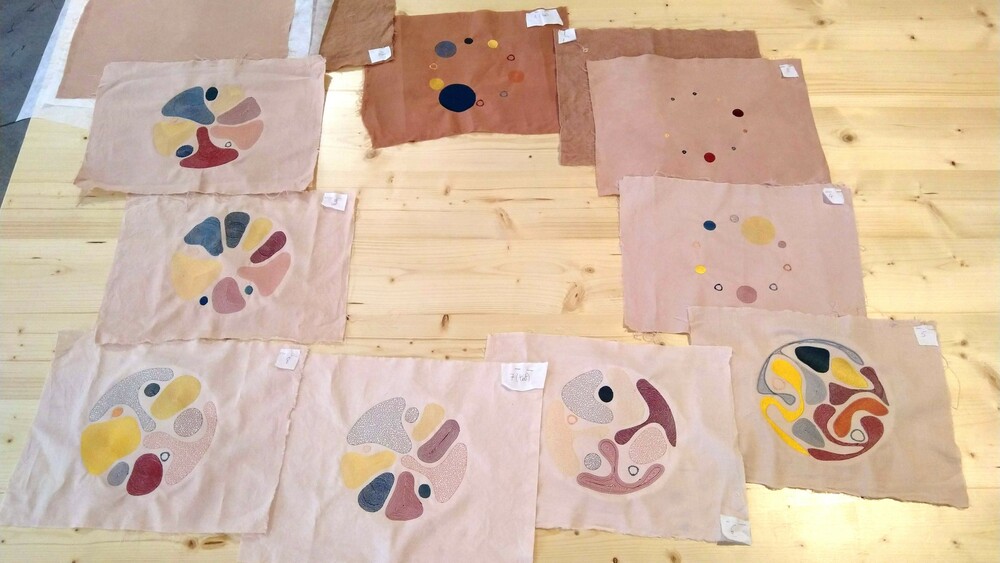
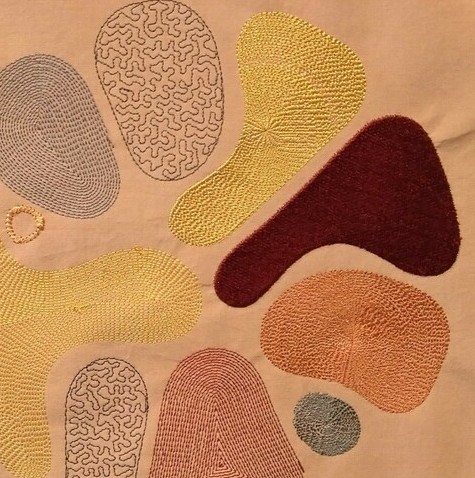
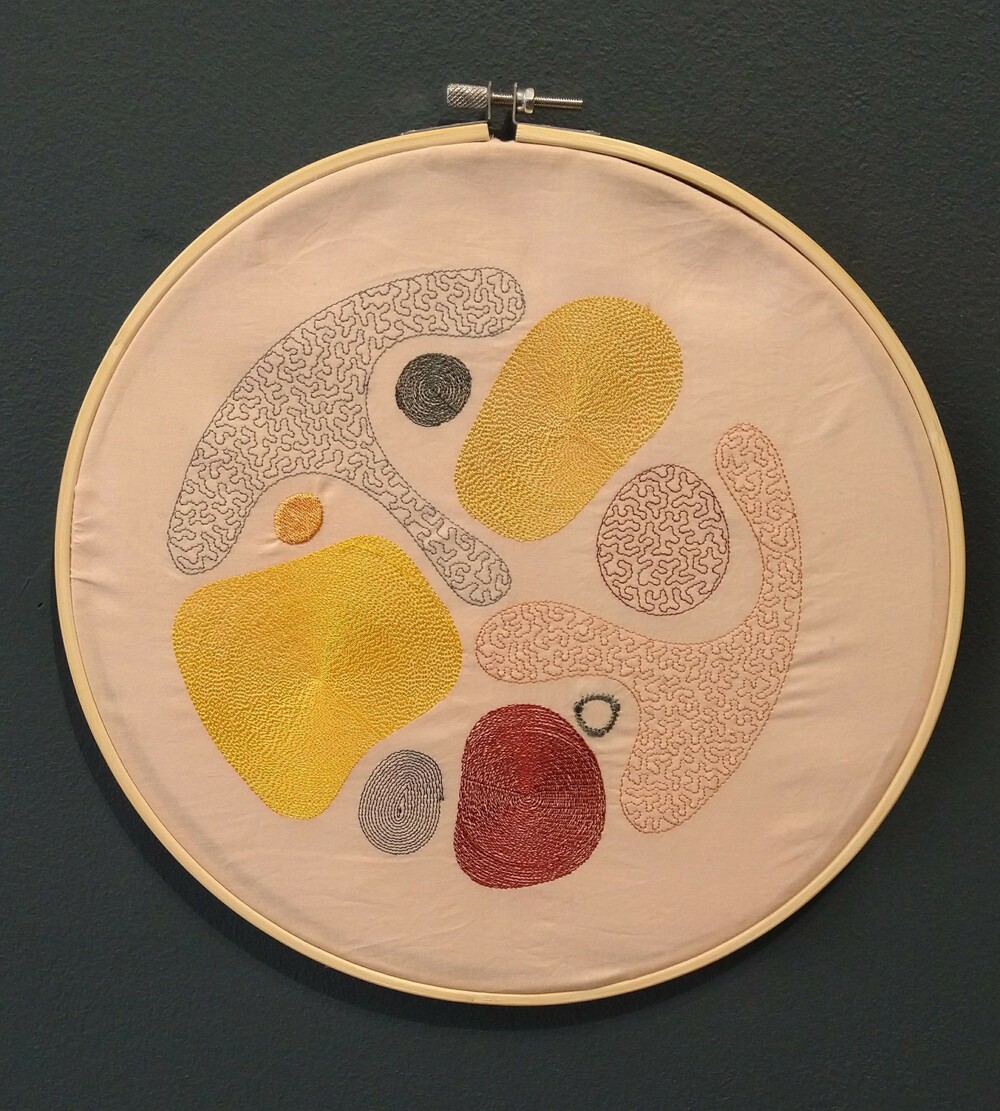
This series of 12 embroideries is a representation of how we talked to each other in my family's group chat in 2020. The data was extracted from WhatsApp, and analyzed over several time intervals, comparing the way we communicated through different times of the day. Each design was created from this data, using computational design and an embroidery machine.
The words we write to each other digitally everyday don't seem to carry as much weight or nostalgia as a paper letter: they are immaterial, and their quantity makes them difficult to apprehend. I wanted to bring them to the material world, in a tangible and unexpected way: changing their finality from a mass of data lost in the cloud to cherished objects.
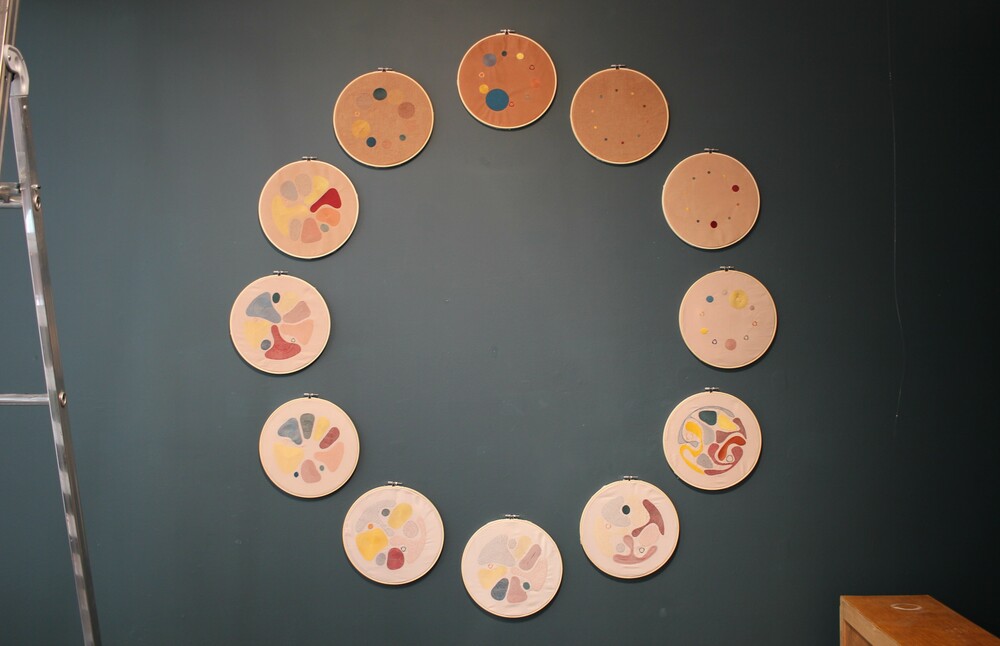
This piece is part of an exhibition held at Le Textile Lab from April 7th, 2021. The exhibition features some other pieces created with these designs, and is a starting point for more explorations around this topic of data materialisation.
Here are some more pictures of the exhibit:
How it's made
WhatsApp chats
To create this piece, my starting point was the data itself: extracting the conversation from WhatsApp, and analyzing it. WhatsApp makes it pretty easy to extract a conversation: in any conversation, it is possible to export the data in a text file format. This is not a veyr useful format for data analysis, but it is very readable for humans. Basically, every line of the file has a date, a time, a name, and the message sent:
19/03/2020 à 08:36 - Fadia: Bonjour à tous et à toutes.😊😊😊😊😊🥰🥰🥰🥰🥰🥰
19/03/2020 à 08:51 - Nabil: Salut les Wakous !
19/03/2020 à 09:09 - Béchara: Bonjour du bureau!
J’espère que vous arrivez toutes et tous à vous inscrire dans la durée avec cette situation particulière !
Avec plein de bisous digitaux 😀😘
19/03/2020 à 09:13 - Ziad: Hé les Wakous, ça vous dit de faire un apéro Zoom ce soir à 19h?
19/03/2020 à 09:13 - Maya: Ouais
19/03/2020 à 09:16 - Béchara: Quelle bonne idée! J’envoie une invitation à tout le monde et ceux qui peuvent pourront se connecter.
An excerpt of an exported WhatsApp chat
Analyzing the data
I wrote a python script that would output the information I wanted from this. For example, the number of messages sent by each person, of the number of photos or emojis they sent. I tried different parameters and inputs for the design, going back and forth between extracting the data I wanted and generating the design. In the end, I went with the number of messages sent by each person as the main parameter. I ran a language analysis to get a sentiment rate from groups of messages, to have a sort of mood indicator, that I will detail further down.
The script I wrote is available on my GitHub page. The output format of this file is JSON, which is still quite readable to humans:
{
    "_comment": "9AM to 11AM",
    "names": ["Anne", "Audrey", "Bechara", "Diane", "Elie", "Fadia", "Maya", "Nabil", "Noe", "Ziad"],
    "nbMessages": [35, 86, 64, 39, 22, 33, 58, 1, 46, 41],
    "nbChar": [1329, 3715, 2783, 1181, 650, 606, 1920, 72, 1169, 2445],
    "positivity": [29, 16, 27, 12, 35, 16, 17, 0, 4, 13]
},
An excerpt of an analyzed JSON file
Computational design
I used the result of this to generate a parametric design with Grasshopper, by directly linking the data file. The jSwan plugin enables using JSON file quite easily within Grasshopper. What I wanted to do was to make each person grow organically on a fixed plane, and be constrained by the growth of the others. I was interested in the effect generated from this, and the fact that it gives a sense of everyone’s place in the groupe, without being traceable back to the data.
I wrote a Grasshopper definition that is heavily inspired from the one in this post. Mine is available on my GitHub page. The README file of the GitHub project details how you can test it yourself, but it basically works in the following way:
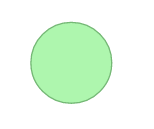
1: Every person in the group chat starts as a small circle
2: Then the main parameter defines in how many parts this circle will be exploded
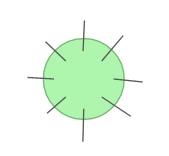
3: Each segment of the circle then grows according to a length parameter that I increase manually.
The main parameter being the number of messages, for a given time-frame, each person takes up a space according to the number of messages they sent, constrained by the other’s growth and the delimiting circle shape that I defined. A person who sent only 5 messages will grow only a little, whereas a person who sent 50 messages will grow a lot. When growing, there is a collision detection so that the line itself does not overlap, but also does not overlap the other lines.
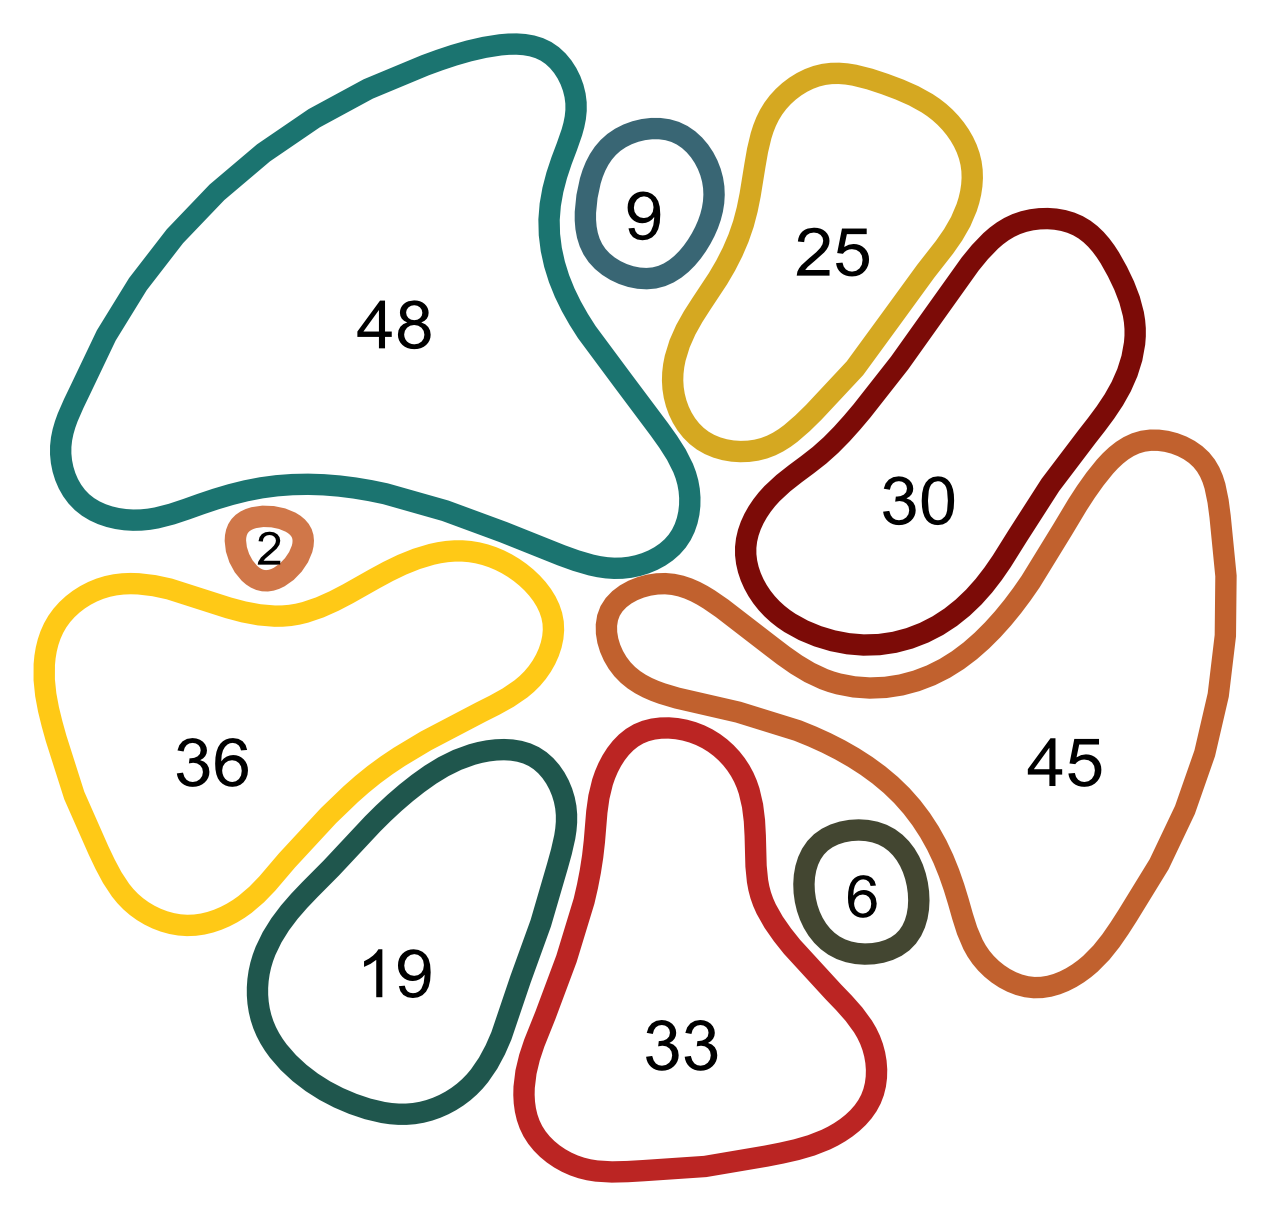
This is an example of one of the time-frames, from 12 PM to 2 PM, with the corresponding number of messages for each person:
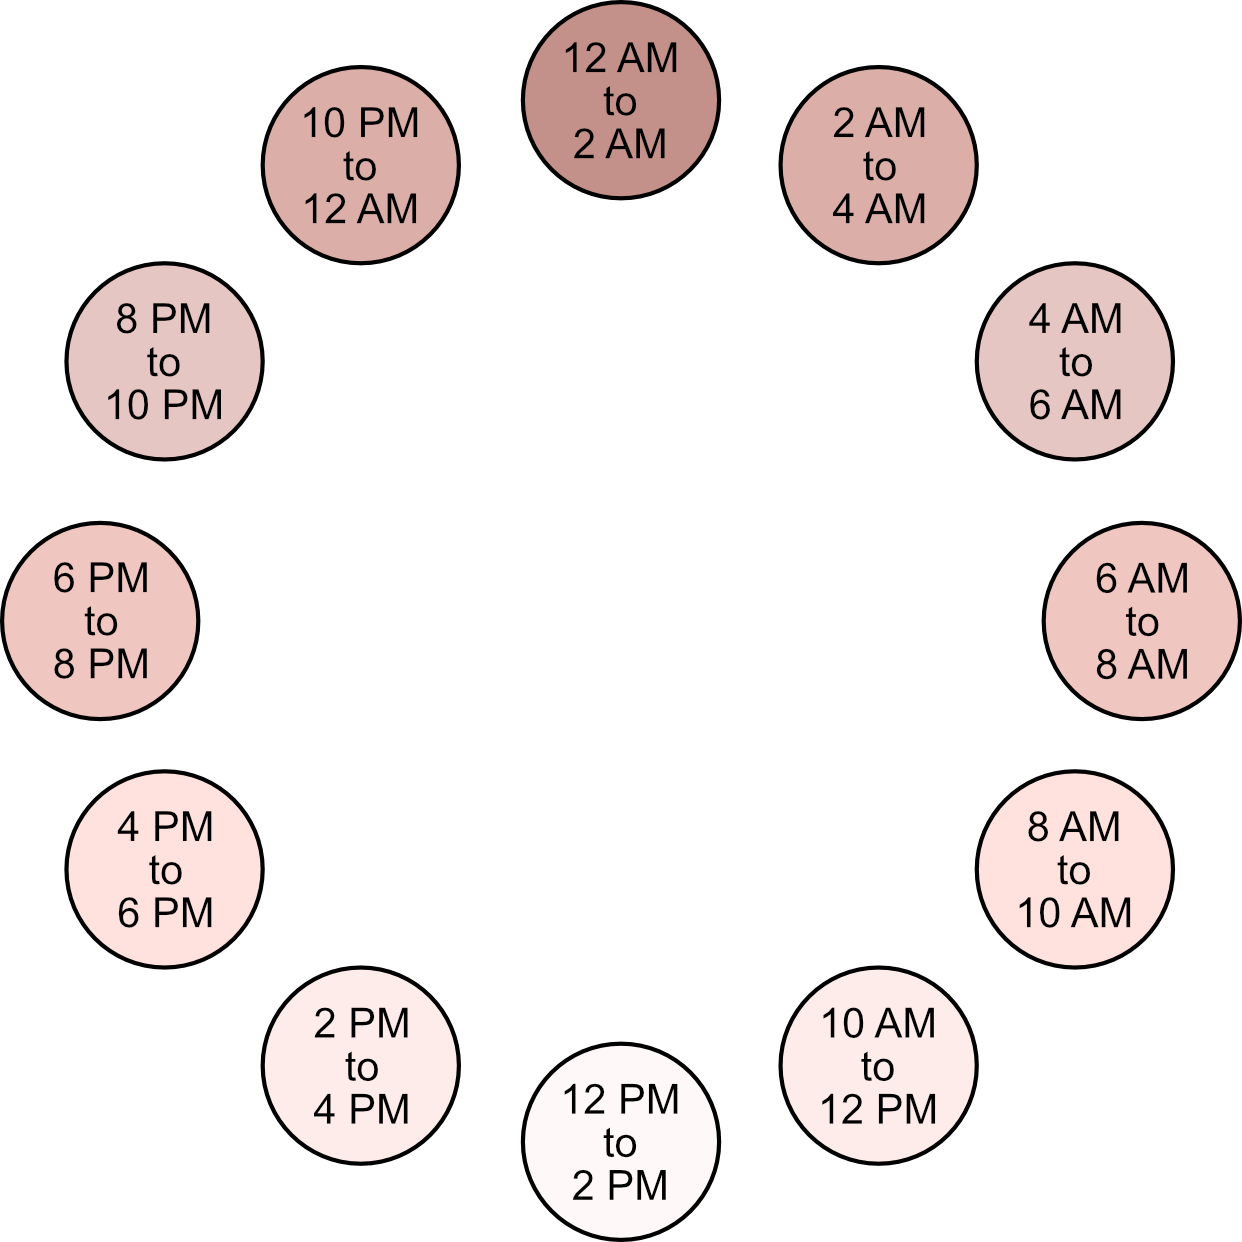
I wanted to make a series that would compare each one's place at different times of the day. So the final input I used splits the data of 2020 in 2 hours-timeframes throughout the day. For example, all the messages sent between 4 and 6 PM over the whole year. We get this sort of “never-ending day of 2020”:
It was once I had chosen this specific input that the layout came together. Prior to this point, I had always placed the series in a linear way, or in a block.
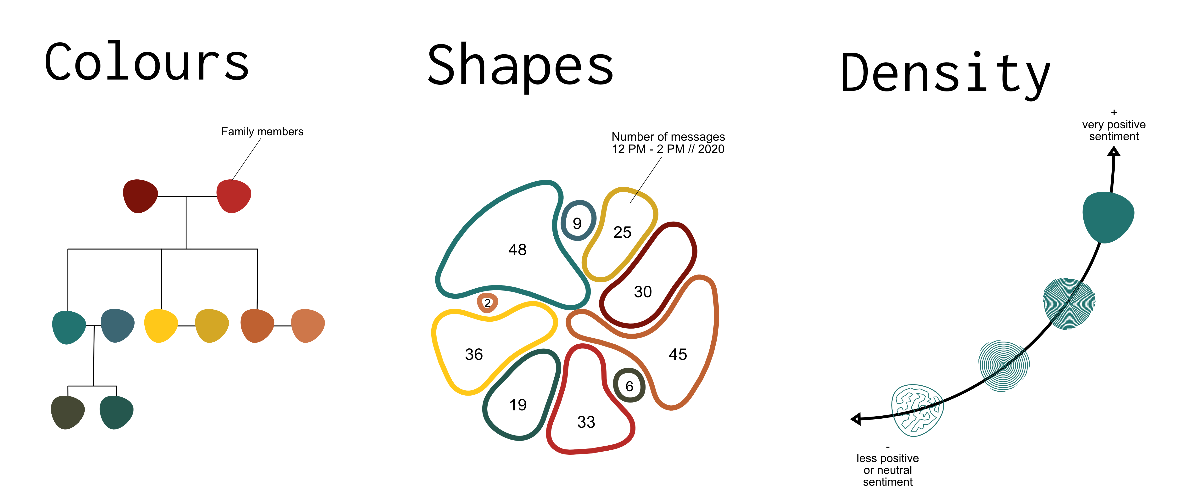
Colours
When starting to think about colours and support material, because of the input and layout I had chosen, I wanted to give a sense of evolution throughout the day. I dyed fabrics with avocado pits, to get the different shades of the day. The darker fabrics indicate nighttime, and lighter fabrics daytime. The daily hours are lighter in colour, but are more filled with messages, which I think balances out pretty well.
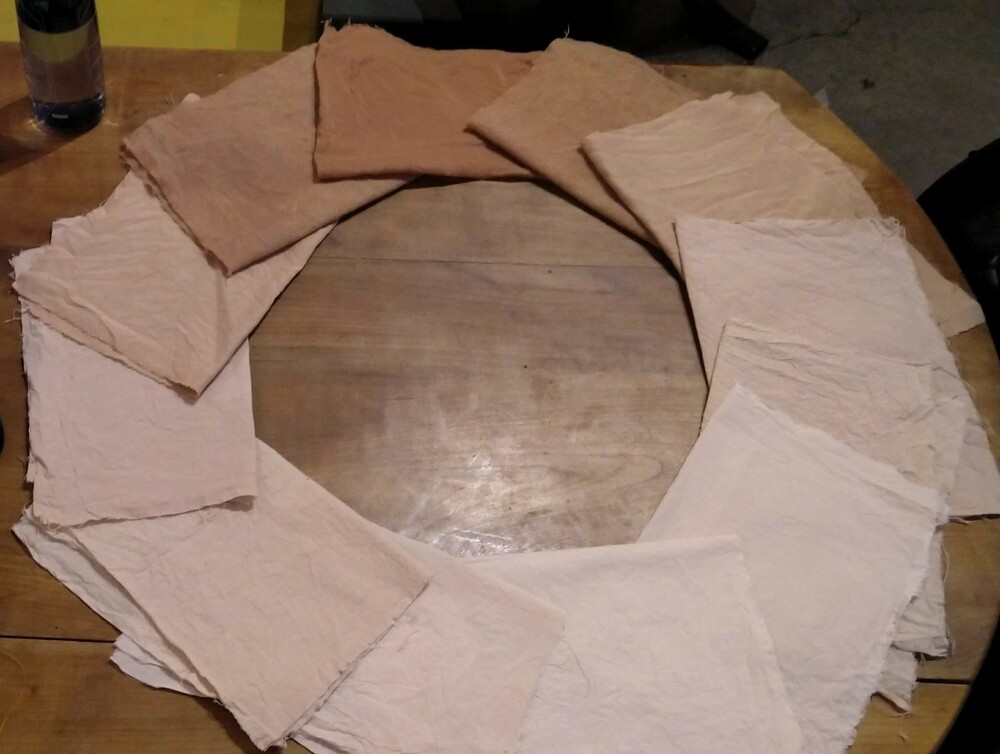
Fabrics dyed with avocado pits, before embroidery
Dyed fabrics embroidered
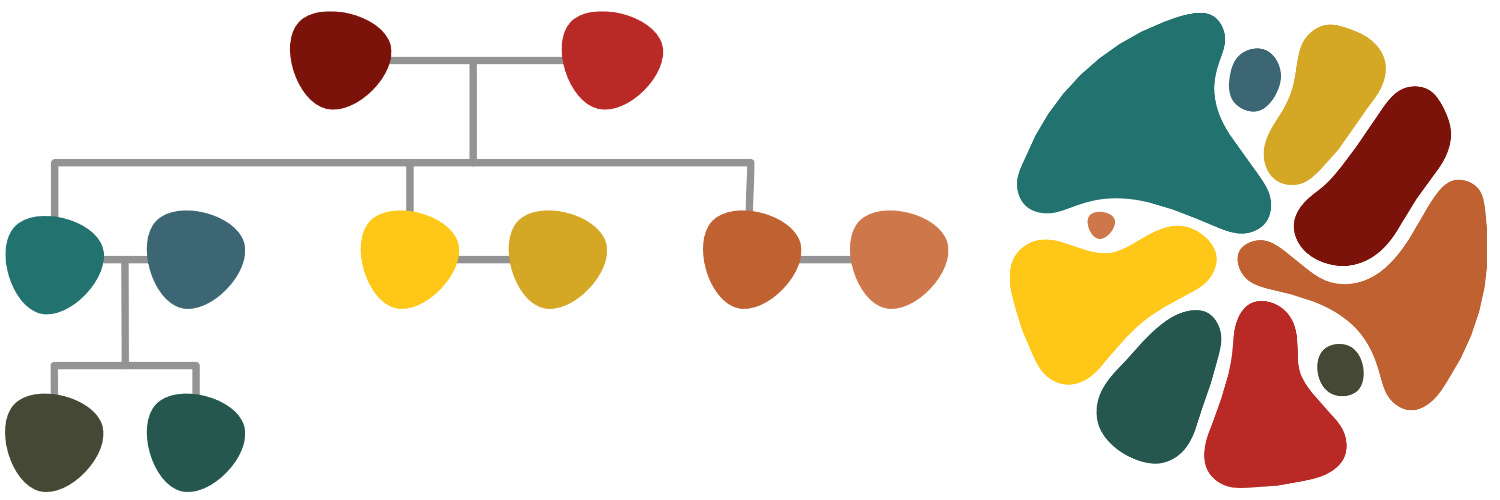
For the thread colours, I wanted to give every person in the group its own colour, so they would identify with it. But there are 10 people in the group, and I still wanted it to be harmonious! I chose a different colour for each family unit inside the group, and used shades of this color.
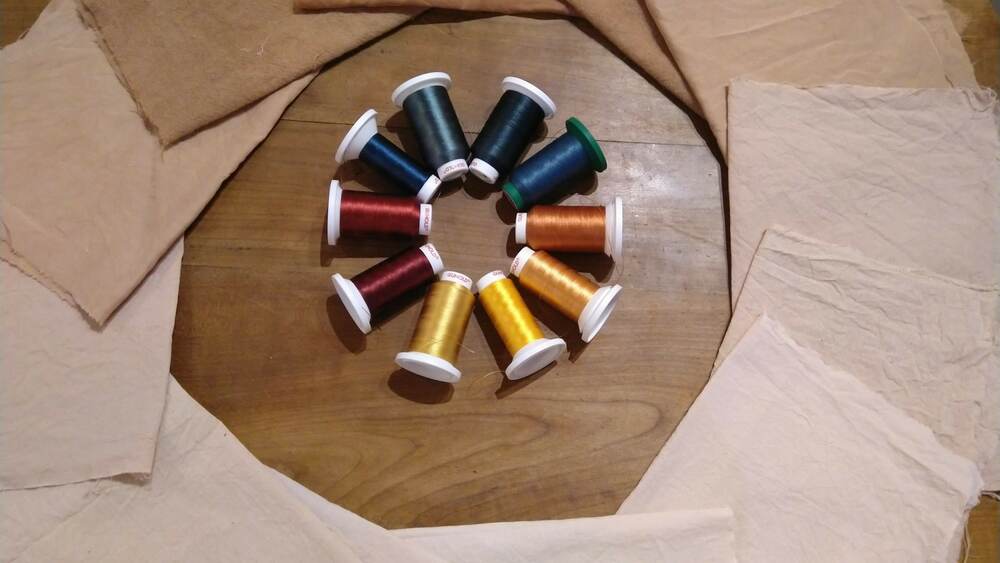
Choosing the thread colours
Here is the corresponding "family tree" with the colours I chose for each person in the family, and next to it an example of the 12 PM to 2 PM time-frame with the same colours:
Embroidering
As I was saying when talking about data analysis, I used a natural language processing library in Python, called textblob to get a sense of the sentiment of the messages. This is not normally something that is used on such short texts, but it did give me interesting results, and highlighted differences between people. This part of the analysis is included in the Python script
from textblob import TextBlob
from textblob_fr import PatternTagger, PatternAnalyzer # for French language

## [...]

for person in family:
        blob = TextBlob(family[person]["content"], pos_tagger=PatternTagger(), analyzer=PatternAnalyzer())
        family[person]["positivity"] = int(blob.sentiment[0]*100)
Sentiment analysis with textblob
After trying to input it at different stages of the design, I decided to use it to have a density scale for the embroidery, going from sparse for less positive or neutral sentiment to very dense for very positive.
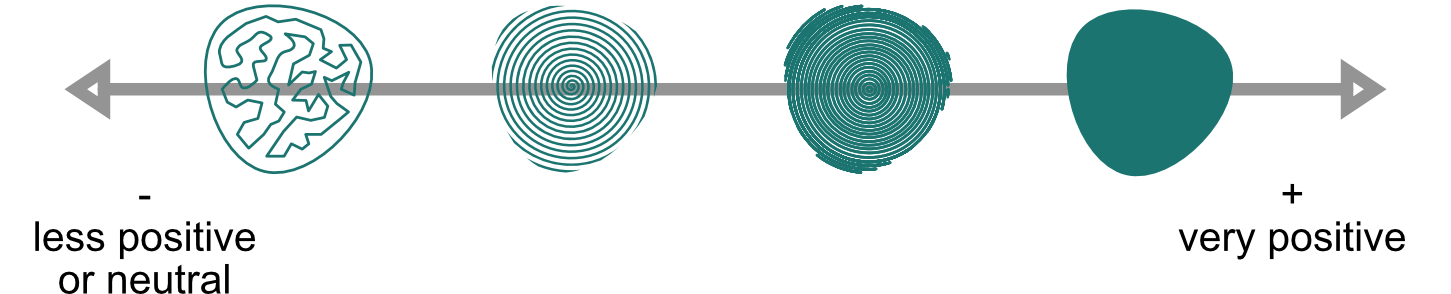
This setting is something that I defined after the shapes were generated, in the embroidery machine software: I mapped the scale of sentiment rates into percentages, split them into 4 intervals, and manually assigned the embroidery styles, which you can all see on this example:
After settling all this, I could embroider the 12 pieces:
They are about 20cm wide, and took from 4 to 40 minutes to complete.
Installation
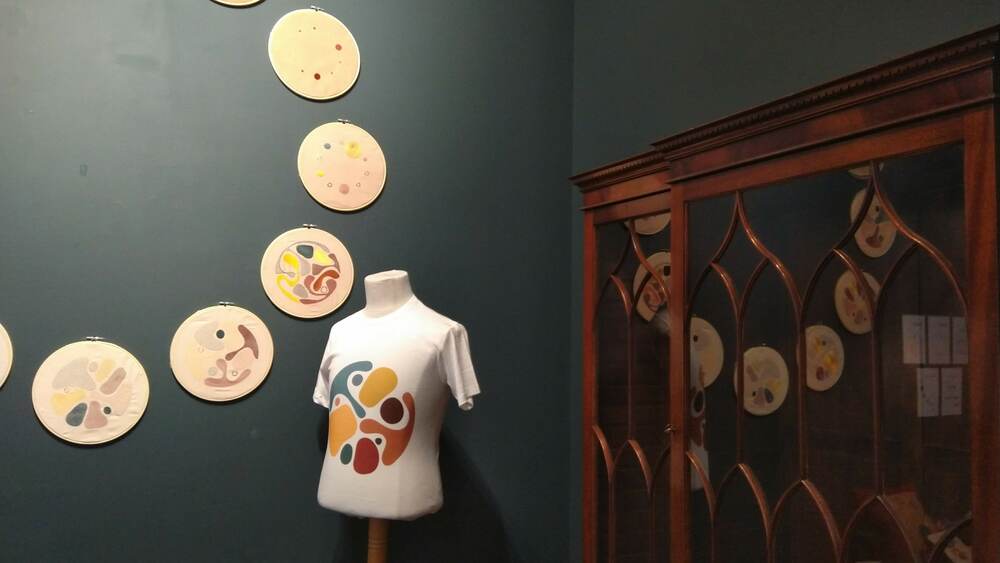
The exhibit takes up a wall of the Textile Lab next to the entrance:
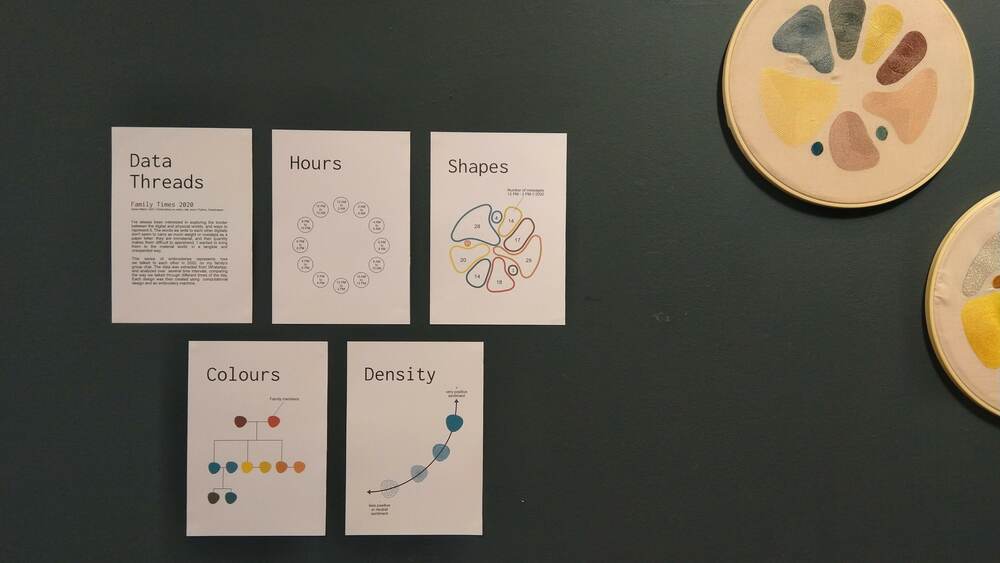
I wrote different labels to explain the main piece; most of them are used in a form or another in this overview page, but here they are in their complete form:
Augmented reality
For the exhibit, I created an augmented reality app, that brings a playful aspect to the piece, and ties it back to the words that initiated it. It was important to me that there was some kind of interaction going on at the exhibit, to enhance the pieces.
I created a smartphone application with Unity and Vuforia, that makes it possible to scan the embroideries. When scanning one of the pieces with the app, messages sent during this timeframe appear next to the shape of the person who sent them. I manually selected the messages that appear for each of the pieces.
You download the application package for Android here: EmbroidARy. You can test it out on the picture below!
Declinations of the design
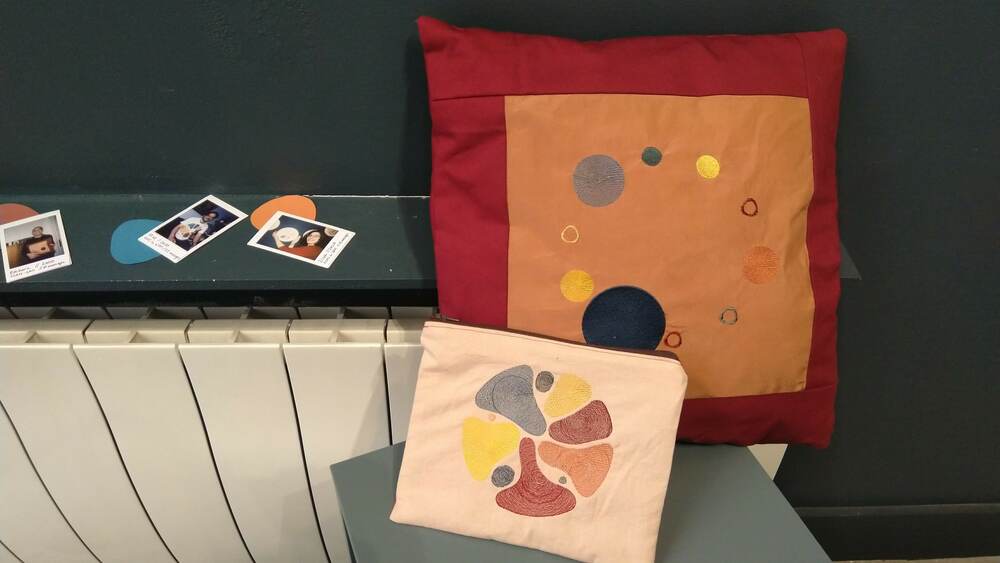
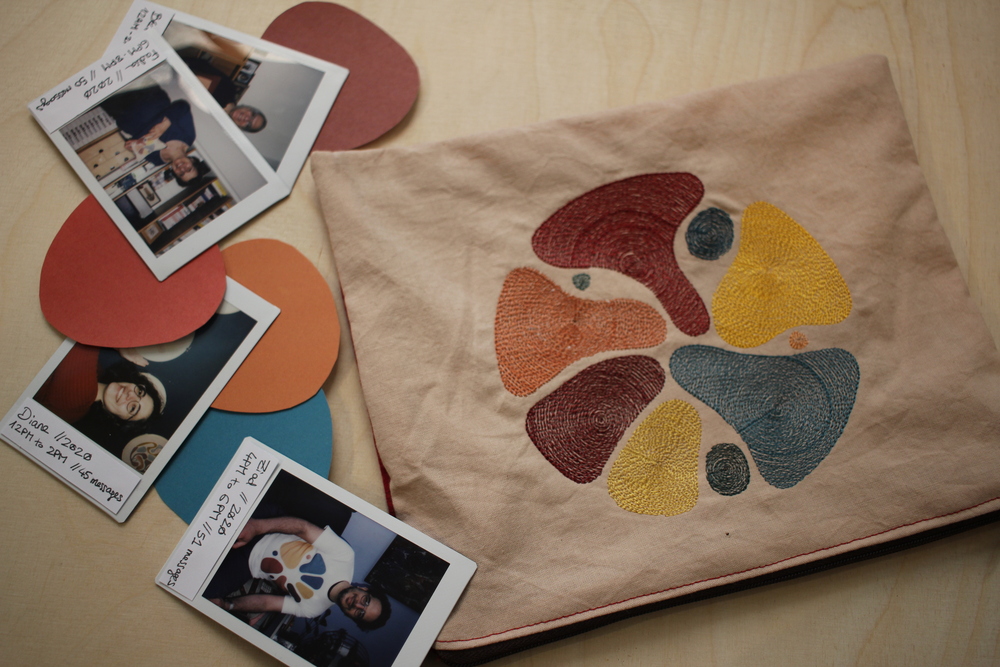
After making this main piece, I started to create declinations of it on other items, with what was available at the lab: a printed t-shirt, a cushion, a clutch bag.
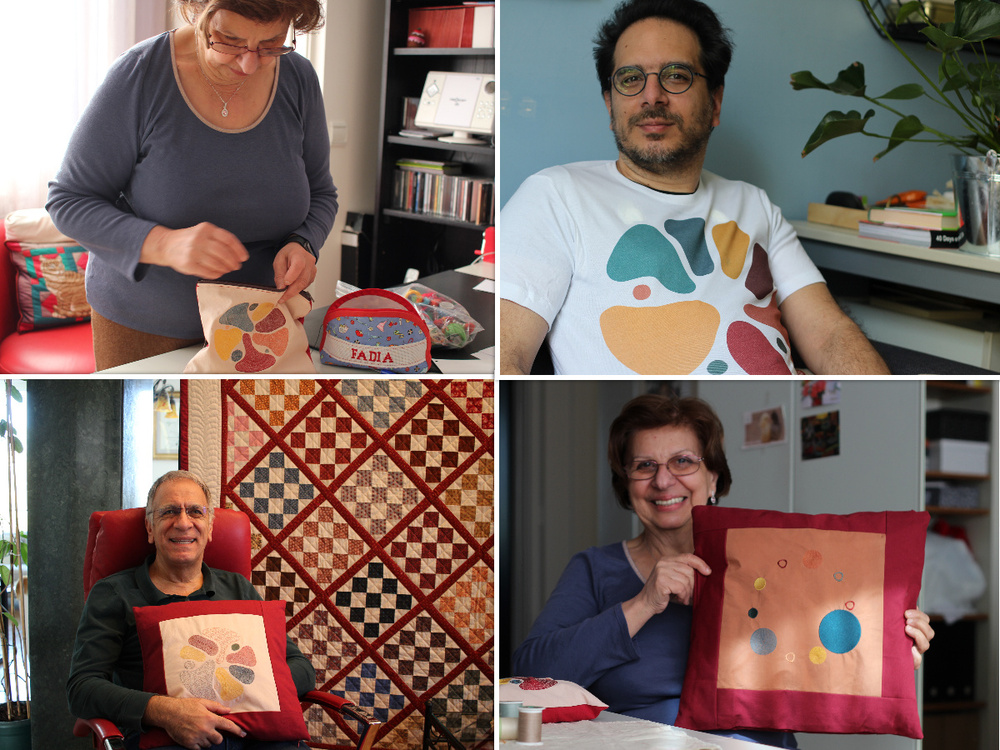
These items are emotional objects to the person represented on the design, linking the family together. They are part of the exhibit, and will go back to the people they were made for after it. Making these objects was another way to make my family part of the project.
The exhibit also features a few polaroids photos of them with the object I made for them, and the number of their messages represented on it
A starting point
I consider this project a starting point of my exploration in art and code, and more specifically data materialisation. There are many things I want to do around this topic (or wish I could have done in the last months!).
🧥 The first one is creating more wearable items. When starting the project, I initially wanted to make knitted scarves out of data. Decorative embroidery was a side-thought at first, and became the focus because it allowed me to create more organic, unordered designs than knitting. I'd like to work more on designing this specifically with wearable items in mind.
🔉 I'd also like to embed interactions within the pieces: touchable interactions, with e-textile swatches incorporated in the design. Having the embroidery talk or sing, react to the touch.
🤖 Generally, the "production chain" of the design could be more automatised. For example: for this exhibit, I created the design in Grasshopper, and then manually exported it and imported it in the proprietary software of our embroidery machine, where I entered some more parameters. I'd like to expand on that and use open-source embroidery sofwares like Turtlestitch to have no intervention at this stage.
🧶 This would allow for an installation that could almost run on its own; I would be interested in creating an installation that would take real-time data as an input, and create an object incrementally when new data arrives. I like imagining this as a very slow process: something created from fast-travelling data but in a very slow way.
👩🏽🎨 I will be open to taking on commissions on this topic: creating art or wearables with other people's data if they want to. In order to do this, I'll have to implement a solution where I don't have access to people's data. For example, they would upload a WhatsApp chat on a platform, which would analyze and format that data to get only what I need, and then delete their file with the messages.
👐 Of course, all of this work being open-source and available, you could also create your own, tweaking the files and design however you want. If someone wants to add another source of data as input, like different types of chats of even a series of tweets, I'm very open to this.
More information
- Read more about the inspirational projects that led me to this
- Follow the project diary, which was (almost) updated every week
- The project on GitHub
- More about Le Textile Lab