BioChromes
This week I joined Kim, Sherry and Myles to explore natural dyeing. I was mainly an assistant, helping with the hands-on work and observing the process. My involvement was smaller this week, but working alongside the team gave me a chance to see how the experiments came together.
We worked with cotton and linen fabric, and wool and silk yarn. The dye materials in our worksheet were woad, goldenrod, madder and logwood. Having different fibers and dyes gave us several samples to look at and compare.
From materials to dye baths
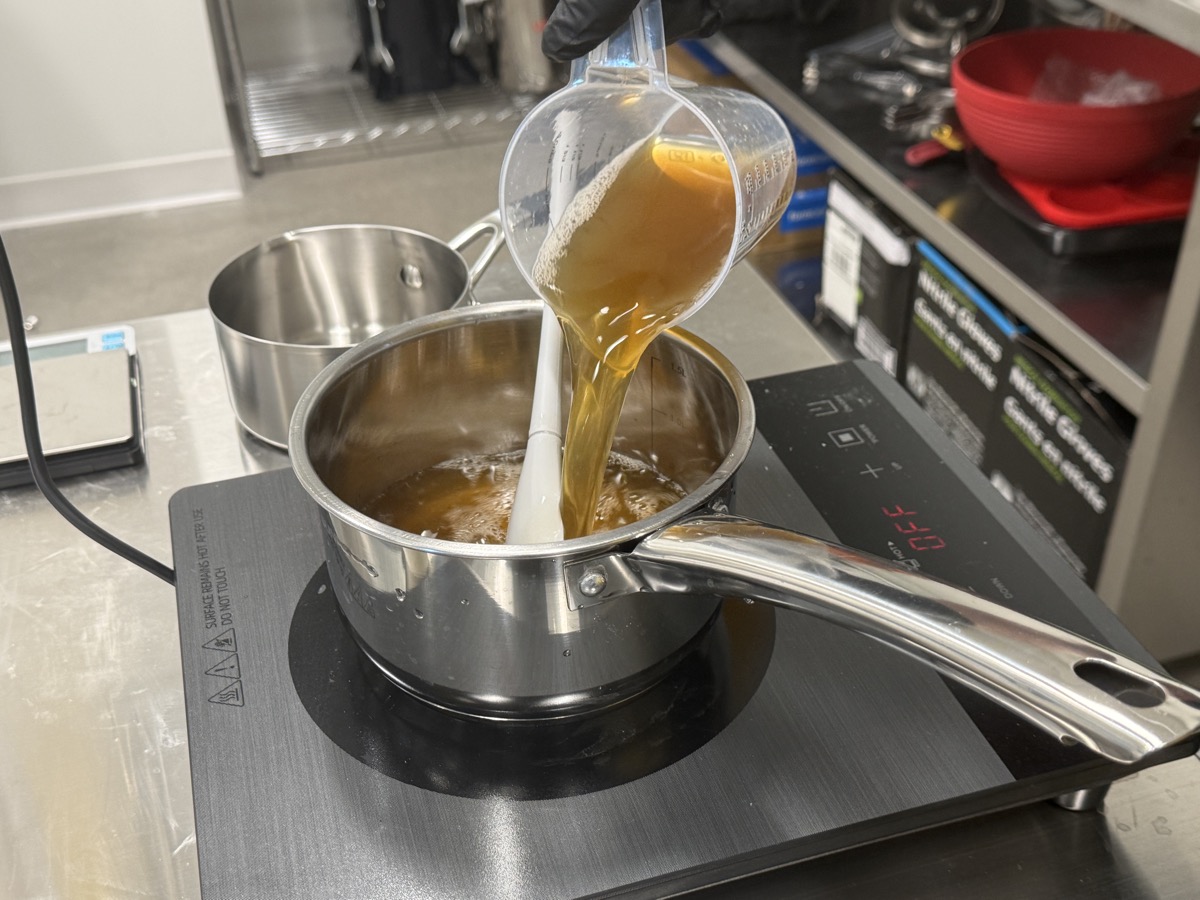
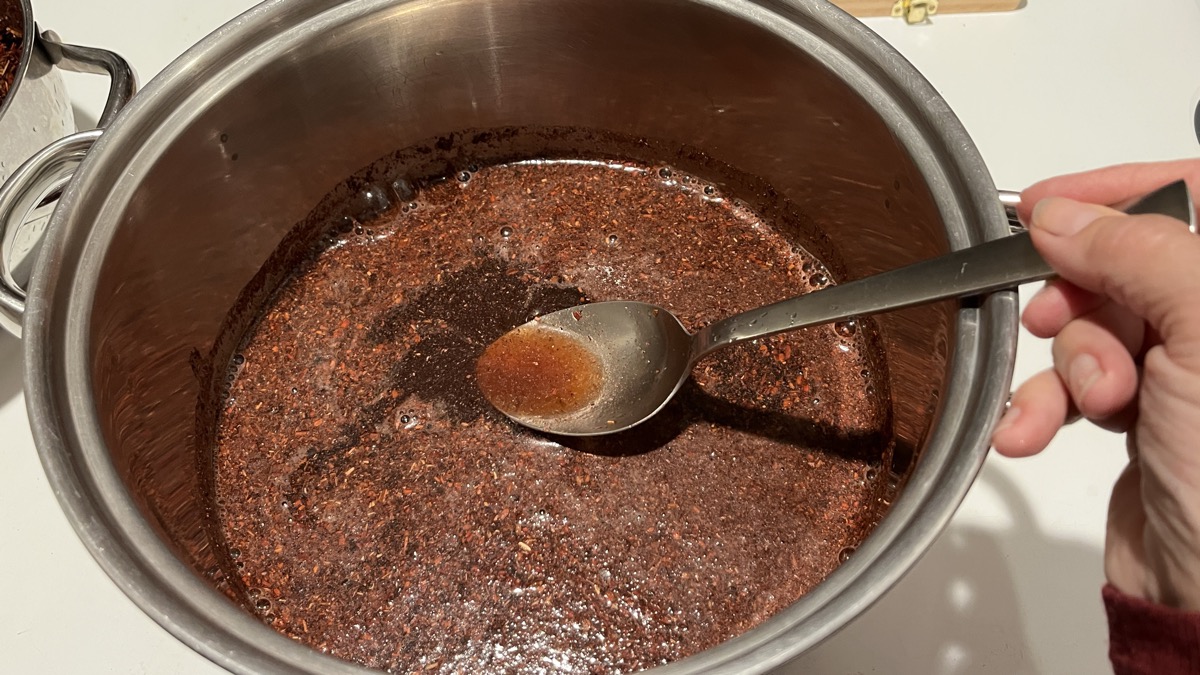
The work involved preparing the materials, weighing the fibers and dyes, and making dye baths. I helped during the practical work and took photos of parts of the process. It was interesting to follow the change from the raw material to the liquid dye, and then to the colored samples.
The photos below show two moments during preparation: pouring the dye liquid into a pot and checking a dye bath. These small steps were part of the team's shared work.
Working out the amounts
Kim and Myles discussed how to calculate the dye-to-fiber proportions. The idea for these calculations came from their discussion, and the team recorded the measurements in the BioChromes data sheet.
The sheet uses a fiber weight of 31.98 g per dye bath to calculate the planned dye amounts. “WoF” means weight of fiber. The percentages below describe the amount of dye material compared with that fiber weight.
| Dye material | Planned proportion (% WoF) | Planned dye amount |
|---|---|---|
| Woad | 50% | 15.99 g |
| Goldenrod | 225% | 71.96 g |
| Madder | 200% | 63.96 g |
| Logwood | 200% | 63.96 g |
These are the planned values recorded in the team's worksheet. Keeping this information together helped connect the samples with the amounts used in the experiment.
Looking at the samples
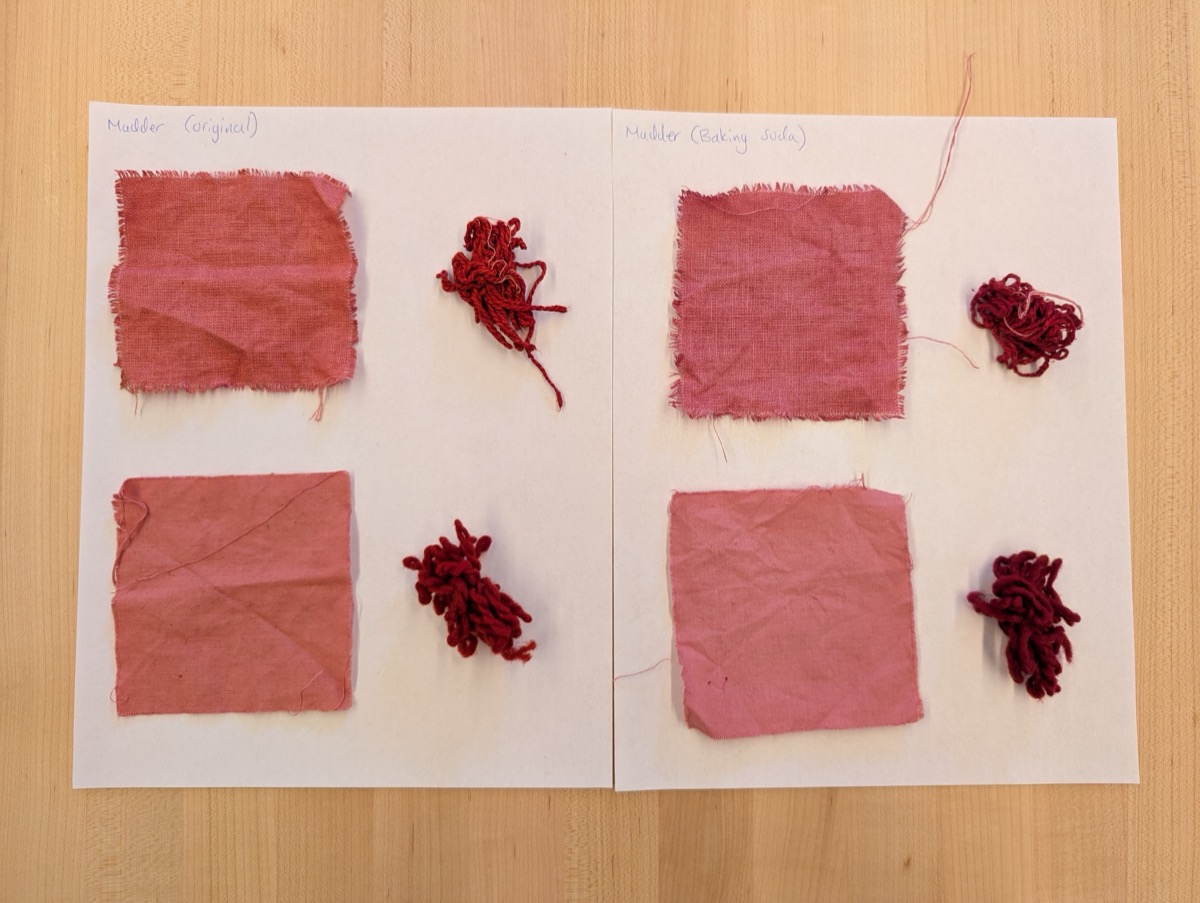
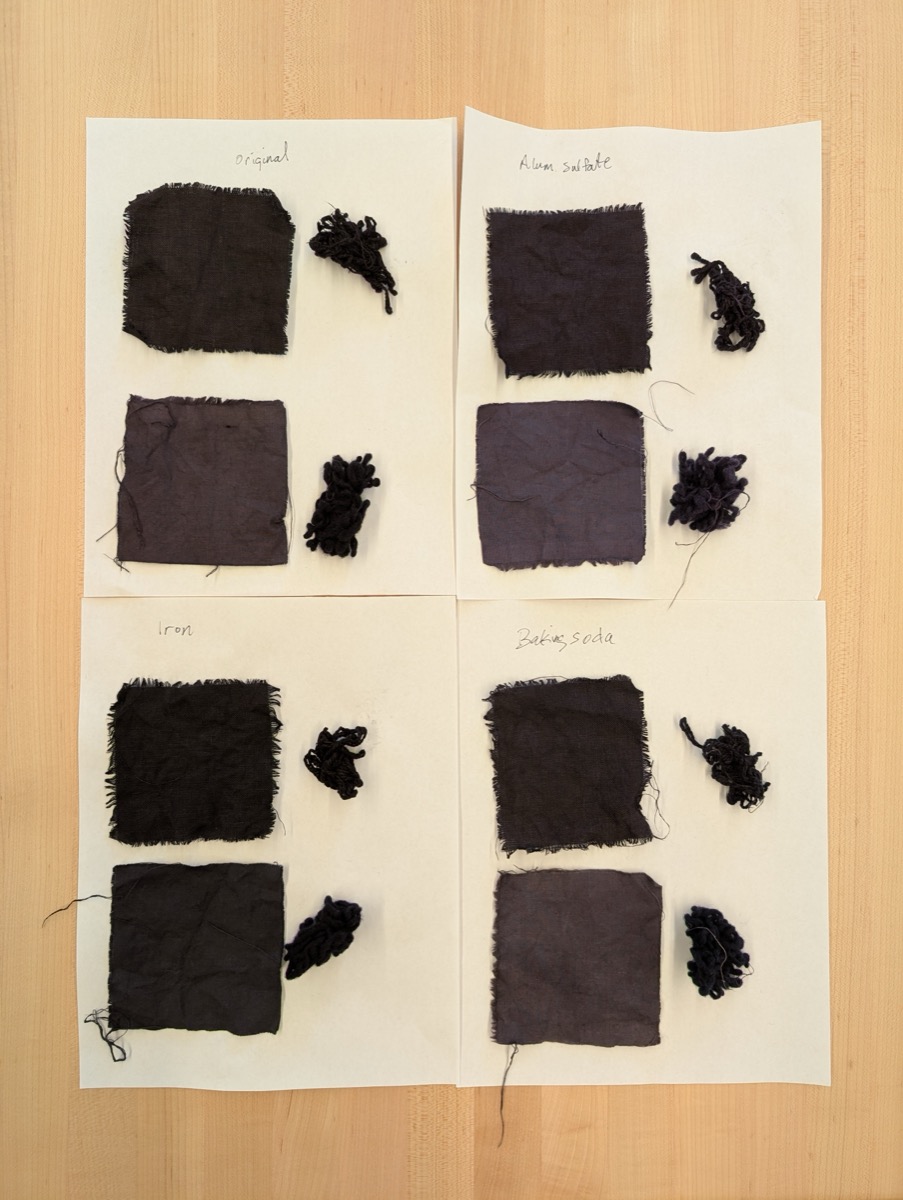
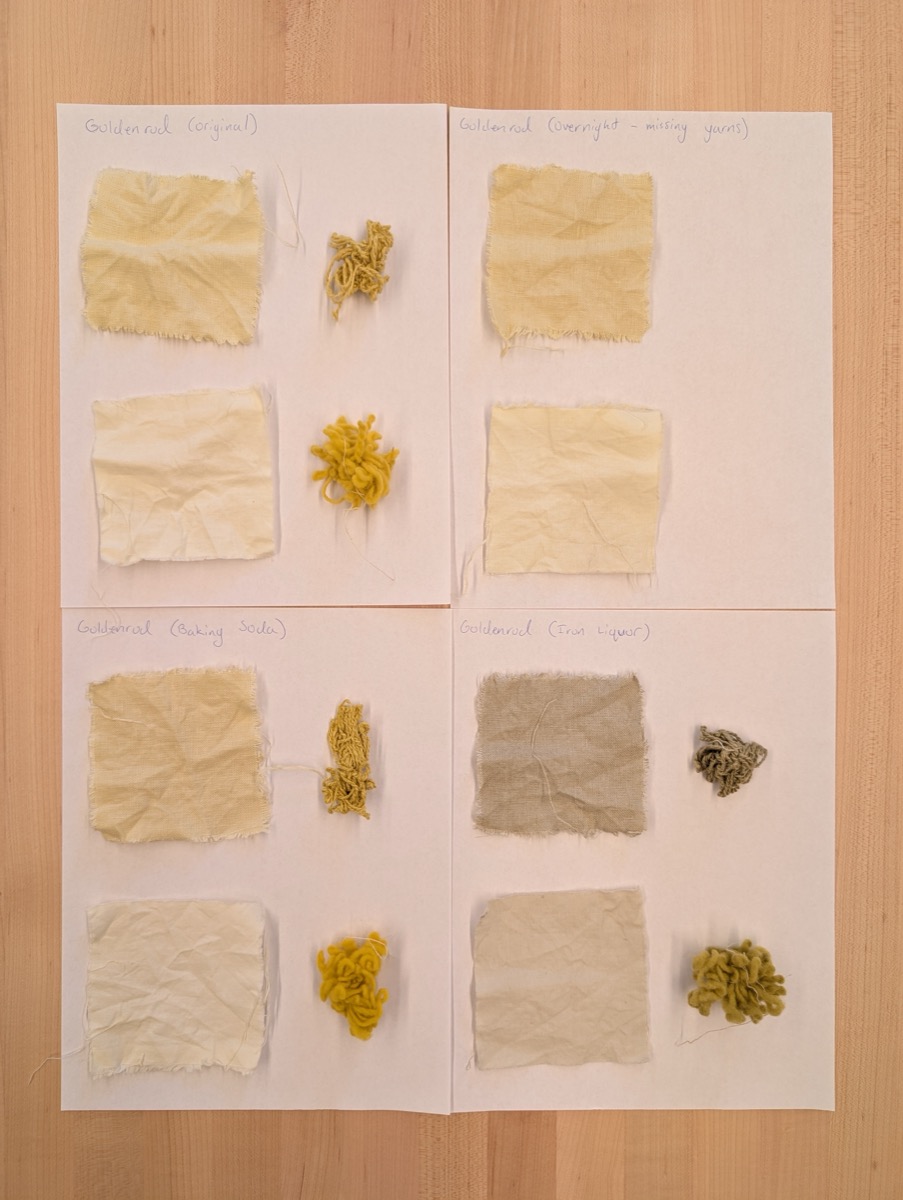
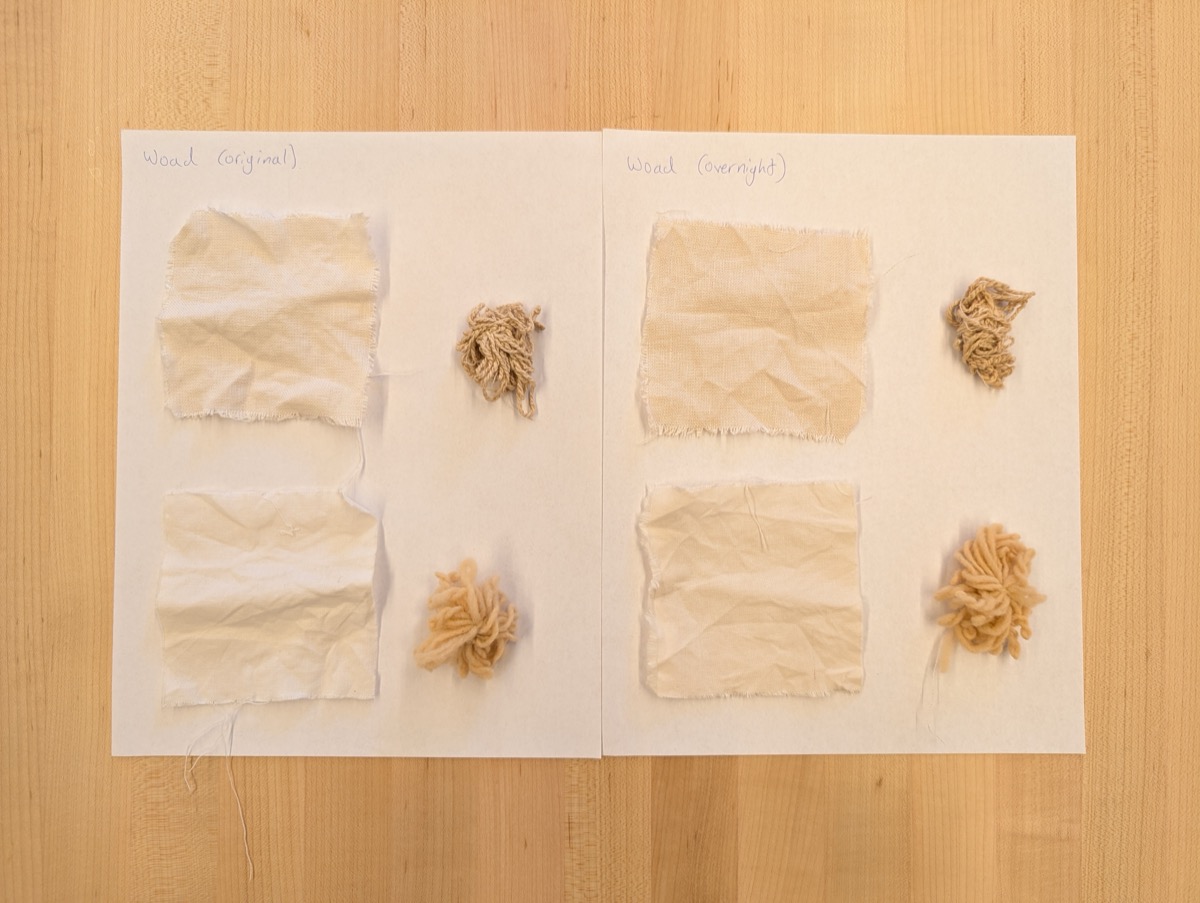
The sample boards made the differences easier to see. Madder gave pink and red tones, while logwood gave much darker purple tones. Goldenrod produced yellow shades, with a more muted color in the samples labeled “Iron Liquor.” The woad samples were pale cream and yellow in the photographed results.
The boards also compare original samples with other treatments or a longer time in the bath. I found it useful to see them side by side. The fabric and yarn did not all look the same, even when they were grouped under the same dye.
Reflection
This was a good introduction to the possibilities of dyeing. Even with a smaller role, I learned by helping and watching the team. I enjoyed seeing how different materials could become sources of color, and how the samples gave us something real to compare.
Time was the main limit. There were more materials and ideas to explore than we could fit into the week. Storage and the materials available also shaped what we could try. I would have liked more time to keep the samples, observe them later, and see how the colors changed after washing or exposure to light.
If I continue this work, I would start with a small set of experiments and record each step more carefully. I would also like to explore colors from other materials and bacteria. This week gave me a starting point and showed me how much more there is to learn.
Photos and data
The Week 04 photo folder contains the team's process and sample photos. The photos shown here were taken by Kim, Myles and me.
The BioChromes data sheet records the team's measurements. Credit for planning the dye proportions goes to Kim and Myles.