1. State of the Art
There are many, many projects and areas that interest me that could fit in the scope of Fabricademy in one way or another. In the interest of feasibility, I chose to restrain myself to documenting only one of those areas first (Data Physicalization) and I intend to come back later and fill this out more as I progress in the program.
Data Physicalization
Data Physicalization is the use of physical artefacts as support for data visualization. In the case of textile objects, data physicalization can serve many purposes beyond informational: artistic, political, practical... The use of traditional crafts provides an interesting contrast with the modernity of data processing methods, while the tangible and tactile aspects of textiles can create a different, more emotional and visceral response to the data itself.
Here is a small selection of data physicalization projects showcasing different techniques:
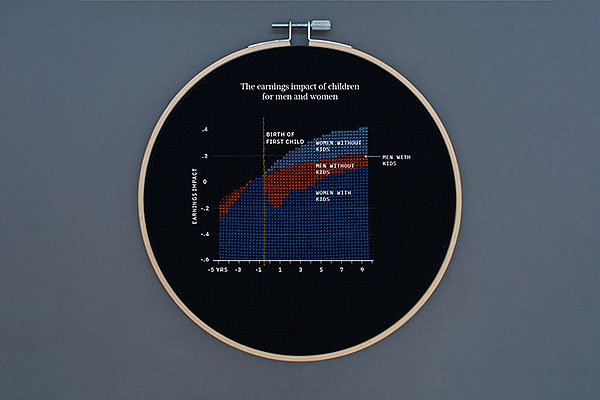 Women's Work (Olivia Johnson, 2021) — Women labor data represented using cross stitch
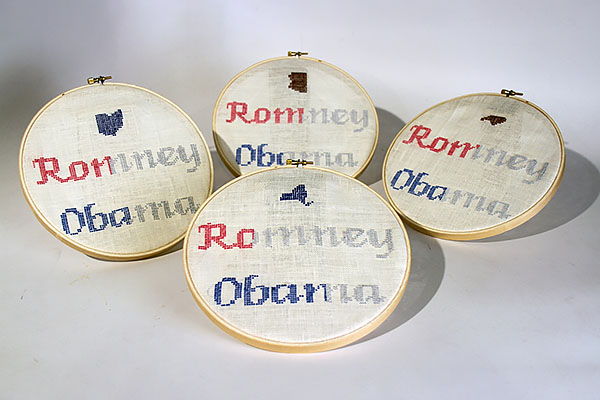 All American Girls (Roopa Vasudevan, 2012) — Voting pattern data represented using cross stitch
 Data Threads (Diane Wakim, 2021) — WhatsApp conversation data represented using machine embroidery
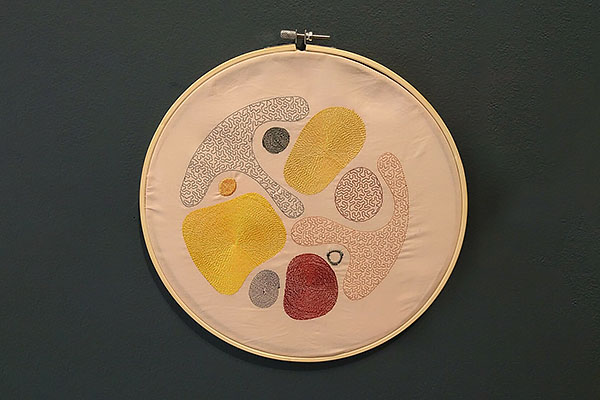
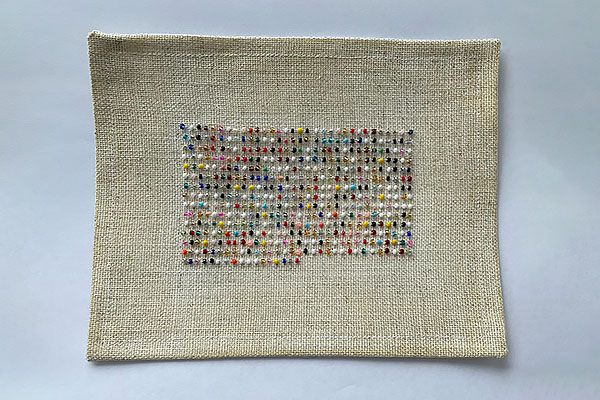 A colour study (Jordan Cunliffe, 2022) — Text analysis data represented using bead embroidery
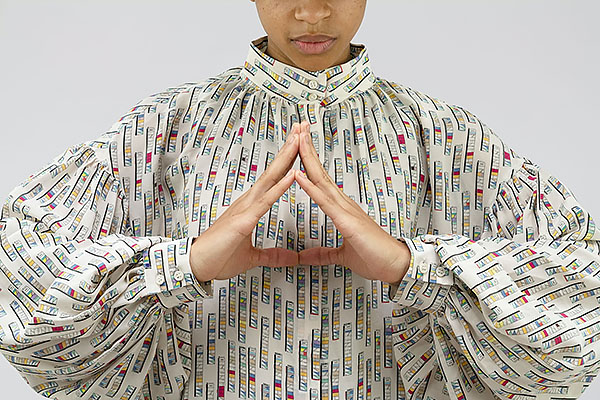 Giorgia Lupi & Other Stories (Giorgia Lupi, 2019) — Algorithmic data patterns printed on fabric and sewn into a garment
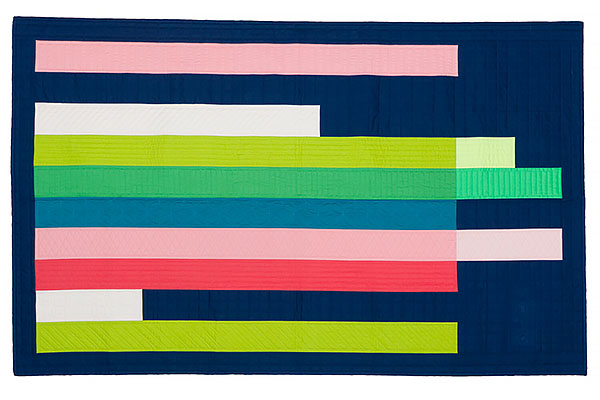 2016 Goal Visualization Quilt (Laura Hartrich, 2019) — Goal completion data represented using patchwork and quilting
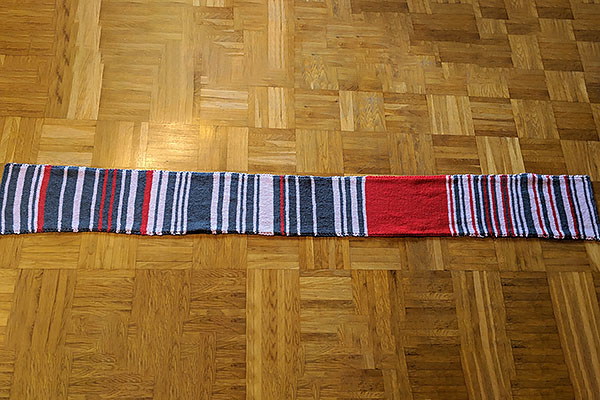 Rail Delay Scarf (Claudia Weber, 2019) — Daily commute data represented on a hand-knitted scarf
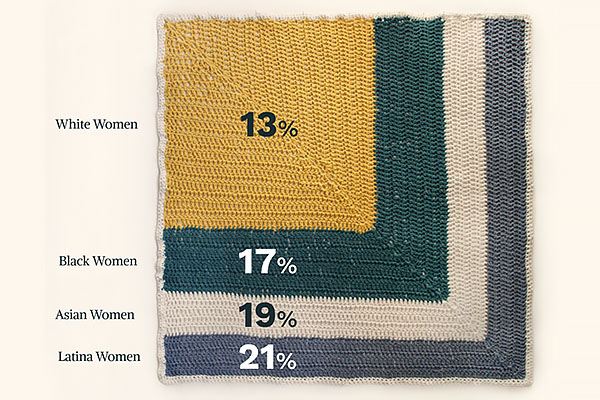 Women, Work, & Covid-19 (Olivia Johnson, 2021) — Women labor data represented using crochet
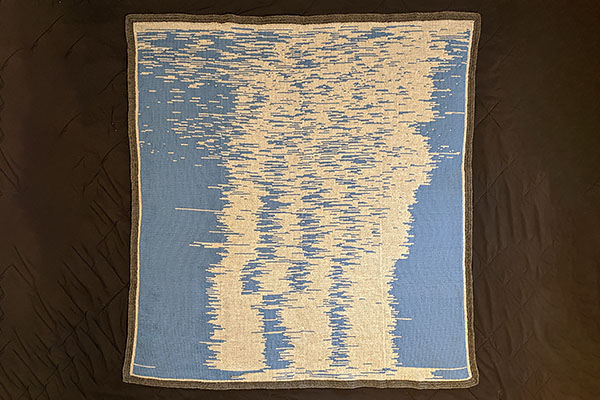 The Sleep Blanket (Seung Lee, 2019) — Infant sleep data represented on a hand-knitted blanket
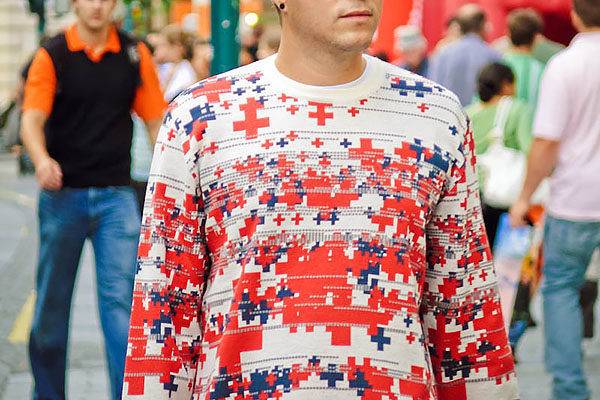 News Knitter (Ebru Kurbak & Mahir Mustafa Yavuz, 2007) — Political news feed data represented on a machine-knitted sweater
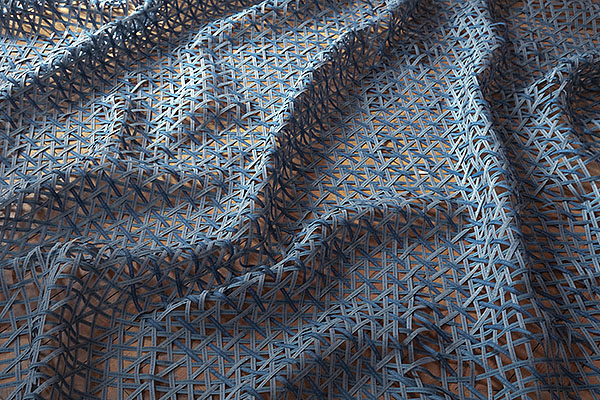 Ti(d)es (Charlotte Bracho, 2022) — Ocean level data represented using printed ribbons woven together
An interesting observation that can be made about all these projects is that the elements used to represent different variables in the data (size, shape, color, placement...) are all transposed from traditional 2D data visualization supports, like print or screens. I would really like to explore what more has or can be done with textiles to represent data in new ways afforded by this medium: 3-dimensionality, texture, drape, stretch...