5. E-textiles
Research
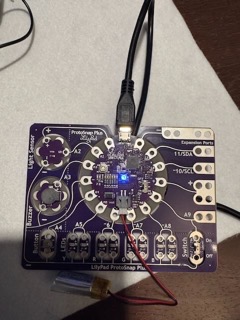
E-textiles, or electronic textiles, are fabrics that integrate digital components and electronics directly into the material. These textiles merge fashion design, engineering, and technology, enabling garments to sense, react, and communicate with the wearer or environment. From light-up performance costumes to biometric fitness shirts, e-textiles represent the intersection of creativity and science in modern fashion.
Early Research Foundations
The foundation of e-textiles can be traced back to research collaborations between MIT Media Lab, NASA, and universities in Europe and Japan in the 1990s. Their goal was to create wearable computers that could collect and transmit data without hindering comfort or mobility. Early experiments used conductive threads, microcontrollers, and soft circuits sewn into clothing. This period gave rise to the idea that garments could serve as both fashion statements and interfaces for technology inspiring new disciplines like wearable computing and smart fabrics.
Innovations Driving the Field
Research in e-textiles continues to expand across multiple domains: • Conductive Materials: Silver-coated fibers, graphene, and carbon nanotubes make it possible to conduct electricity while remaining soft and washable. • Energy Generation: Solar-powered fibers and kinetic-energy textiles allow garments to self-charge or power small devices. • Health and Wellness: E-textiles now monitor heart rate, respiration, muscle activity, and hydration, often connected to smartphone apps for real-time analysis. • Fashion and Performance: Designers use LED threads and flexible circuits to create garments that light up, change color, or respond to sound and motion.
References & Inspiration
Hussein Chalayan
A pioneer in techno-fashion, Chalayan’s collections have featured transforming garments — dresses that change shape, light up, or move autonomously using embedded motors and sensors. His work explores identity, migration, and movement through technology as performance art.
 {width=400}
Photo from www.waldemeyer.com
CuteCircuit
 {width=400}
Photo from CuteCircuit.com
This London-based brand creates interactive LED garments and social media–connected clothing. Their iconic “Twitter Dress” displayed live tweets across an illuminated textile surface. Celebrities such as Katy Perry and Nicole Scherzinger have worn their pieces on stage.
Pauline van Dongen
A Dutch designer blending functionality and sustainability, van Dongen has produced solar-powered jackets, illuminated running gear, and textiles that harvest energy. Her work shows how wearable technology can enhance everyday life.
 { width=400 }
Photo from Pauline van Dongen.com
Tools
Circuit Schematics and AI Use
The first schematic shows the analog Velostat pressure sensor circuit. The Velostat sensor is connected to the LilyPad through analog pin A9 and uses a 10 kΩ resistor to create a voltage divider. This allows the LilyPad to read a range of pressure values using analogRead().
The second schematic shows the digital soft textile switch. Two conductive layers are separated by a foam spacer. When pressure is applied, the conductive layers make contact and the LilyPad reads a LOW state. When released, the LilyPad reads a HIGH state.
I used ChatGPT to help create and understand the electronic schematics and troubleshoot the wiring and sensor connections.
AI Prompt:
"Create a simple electronic schematic showing how to connect a handmade analog Velostat pressure sensor and a digital soft textile switch to a LilyPad microcontroller."
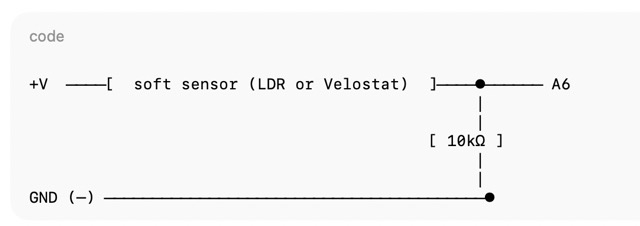
Analog Velostat pressure sensor schematic.
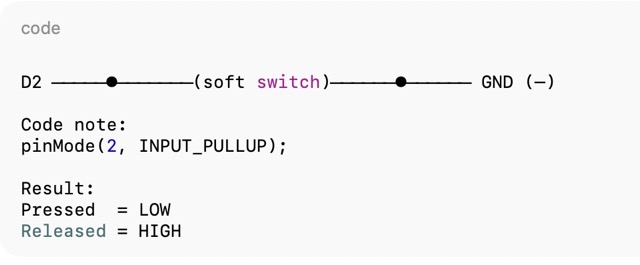
Digital soft textile switch schematic.
Process and workflow
Arduino IDE
Arduino Integrated Development Environment (IDE) is the software you use to:
✅ Write code ✅ Check (compile) code ✅ Upload code to Arduino/LilyPad boards
It’s the interface between the computer and the microcontroller on a board... i.e., LilyPad ProtoSnap Plus
How to Upload Code to the LilyPad
- Connect the LilyPad ProtoSnap Plus to the computer using USB.
- Open Arduino IDE.
- Go to Tools → Board → SparkFun AVR Boards → LilyPad USB Plus.
- Go to Tools → Port and select the LilyPad USB port.
- Click Verify ✔️ to compile the code.
- Click Upload ➡️ to upload the sketch to the LilyPad.
- Open the Serial Monitor and set the baud rate to 9600.
Analog soft sensor
The Velostat changes resistance when pressure is applied. The LilyPad reads the changing voltage as an analog value using analogRead(). The available analog reading range is 0–1023.
Materials
•   Velostat (pressure-sensitive plastic)
•   Aluminum foil
•   Green felt
•   10kΩ resistor
•   Alligator clips
•   Multimeter
Building the Analog Soft Sensor
The analog pressure sensor was constructed as a layered textile sandwich:
- I cut two pieces of aluminum foil to create the conductive electrodes.
- I cut a piece of Velostat to fit between the aluminum foil layers.
- The Velostat was placed between the two aluminum foil electrodes.
- One conductive layer was connected to the power path, while the sensor output was connected to analog pin A9 on the LilyPad ProtoSnap Plus.
- A 10 kΩ resistor was used to create a voltage divider between the sensor signal and ground.
- Felt was added around the sensor layers to create a soft structure and keep the materials aligned.
The completed sensor changed resistance when pressure was applied.
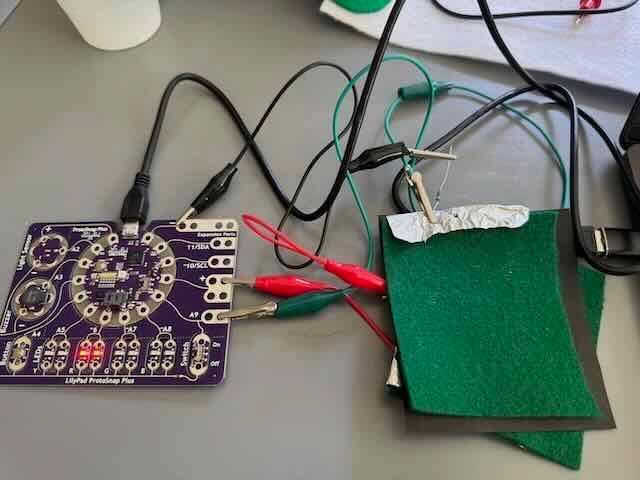
I connected the handmade Velostat pressure sensor to analog pin A9 on the LilyPad ProtoSnap Plus. The sensor was constructed from two aluminum foil electrodes with Velostat positioned between them. The
layers were enclosed with felt to create a soft textile pressure sensor. The Arduino sketch used the analogRead() function to measure the changing voltage produced by the pressure sensor. The Serial Monitor was opened at 9600 baud.
During the test, the sensor produced readings ranging from approximately 128 to 168 as pressure was applied and released. The changing values confirm that the Velostat sensor functions as an analog input rather than a simple HIGH/LOW switch. The LilyPad analog input is capable of reporting values from 0 to 1023, but the exact range produced by a handmade sensor depends on the Velostat, electrode contact, resistor value, pressure, and construction.
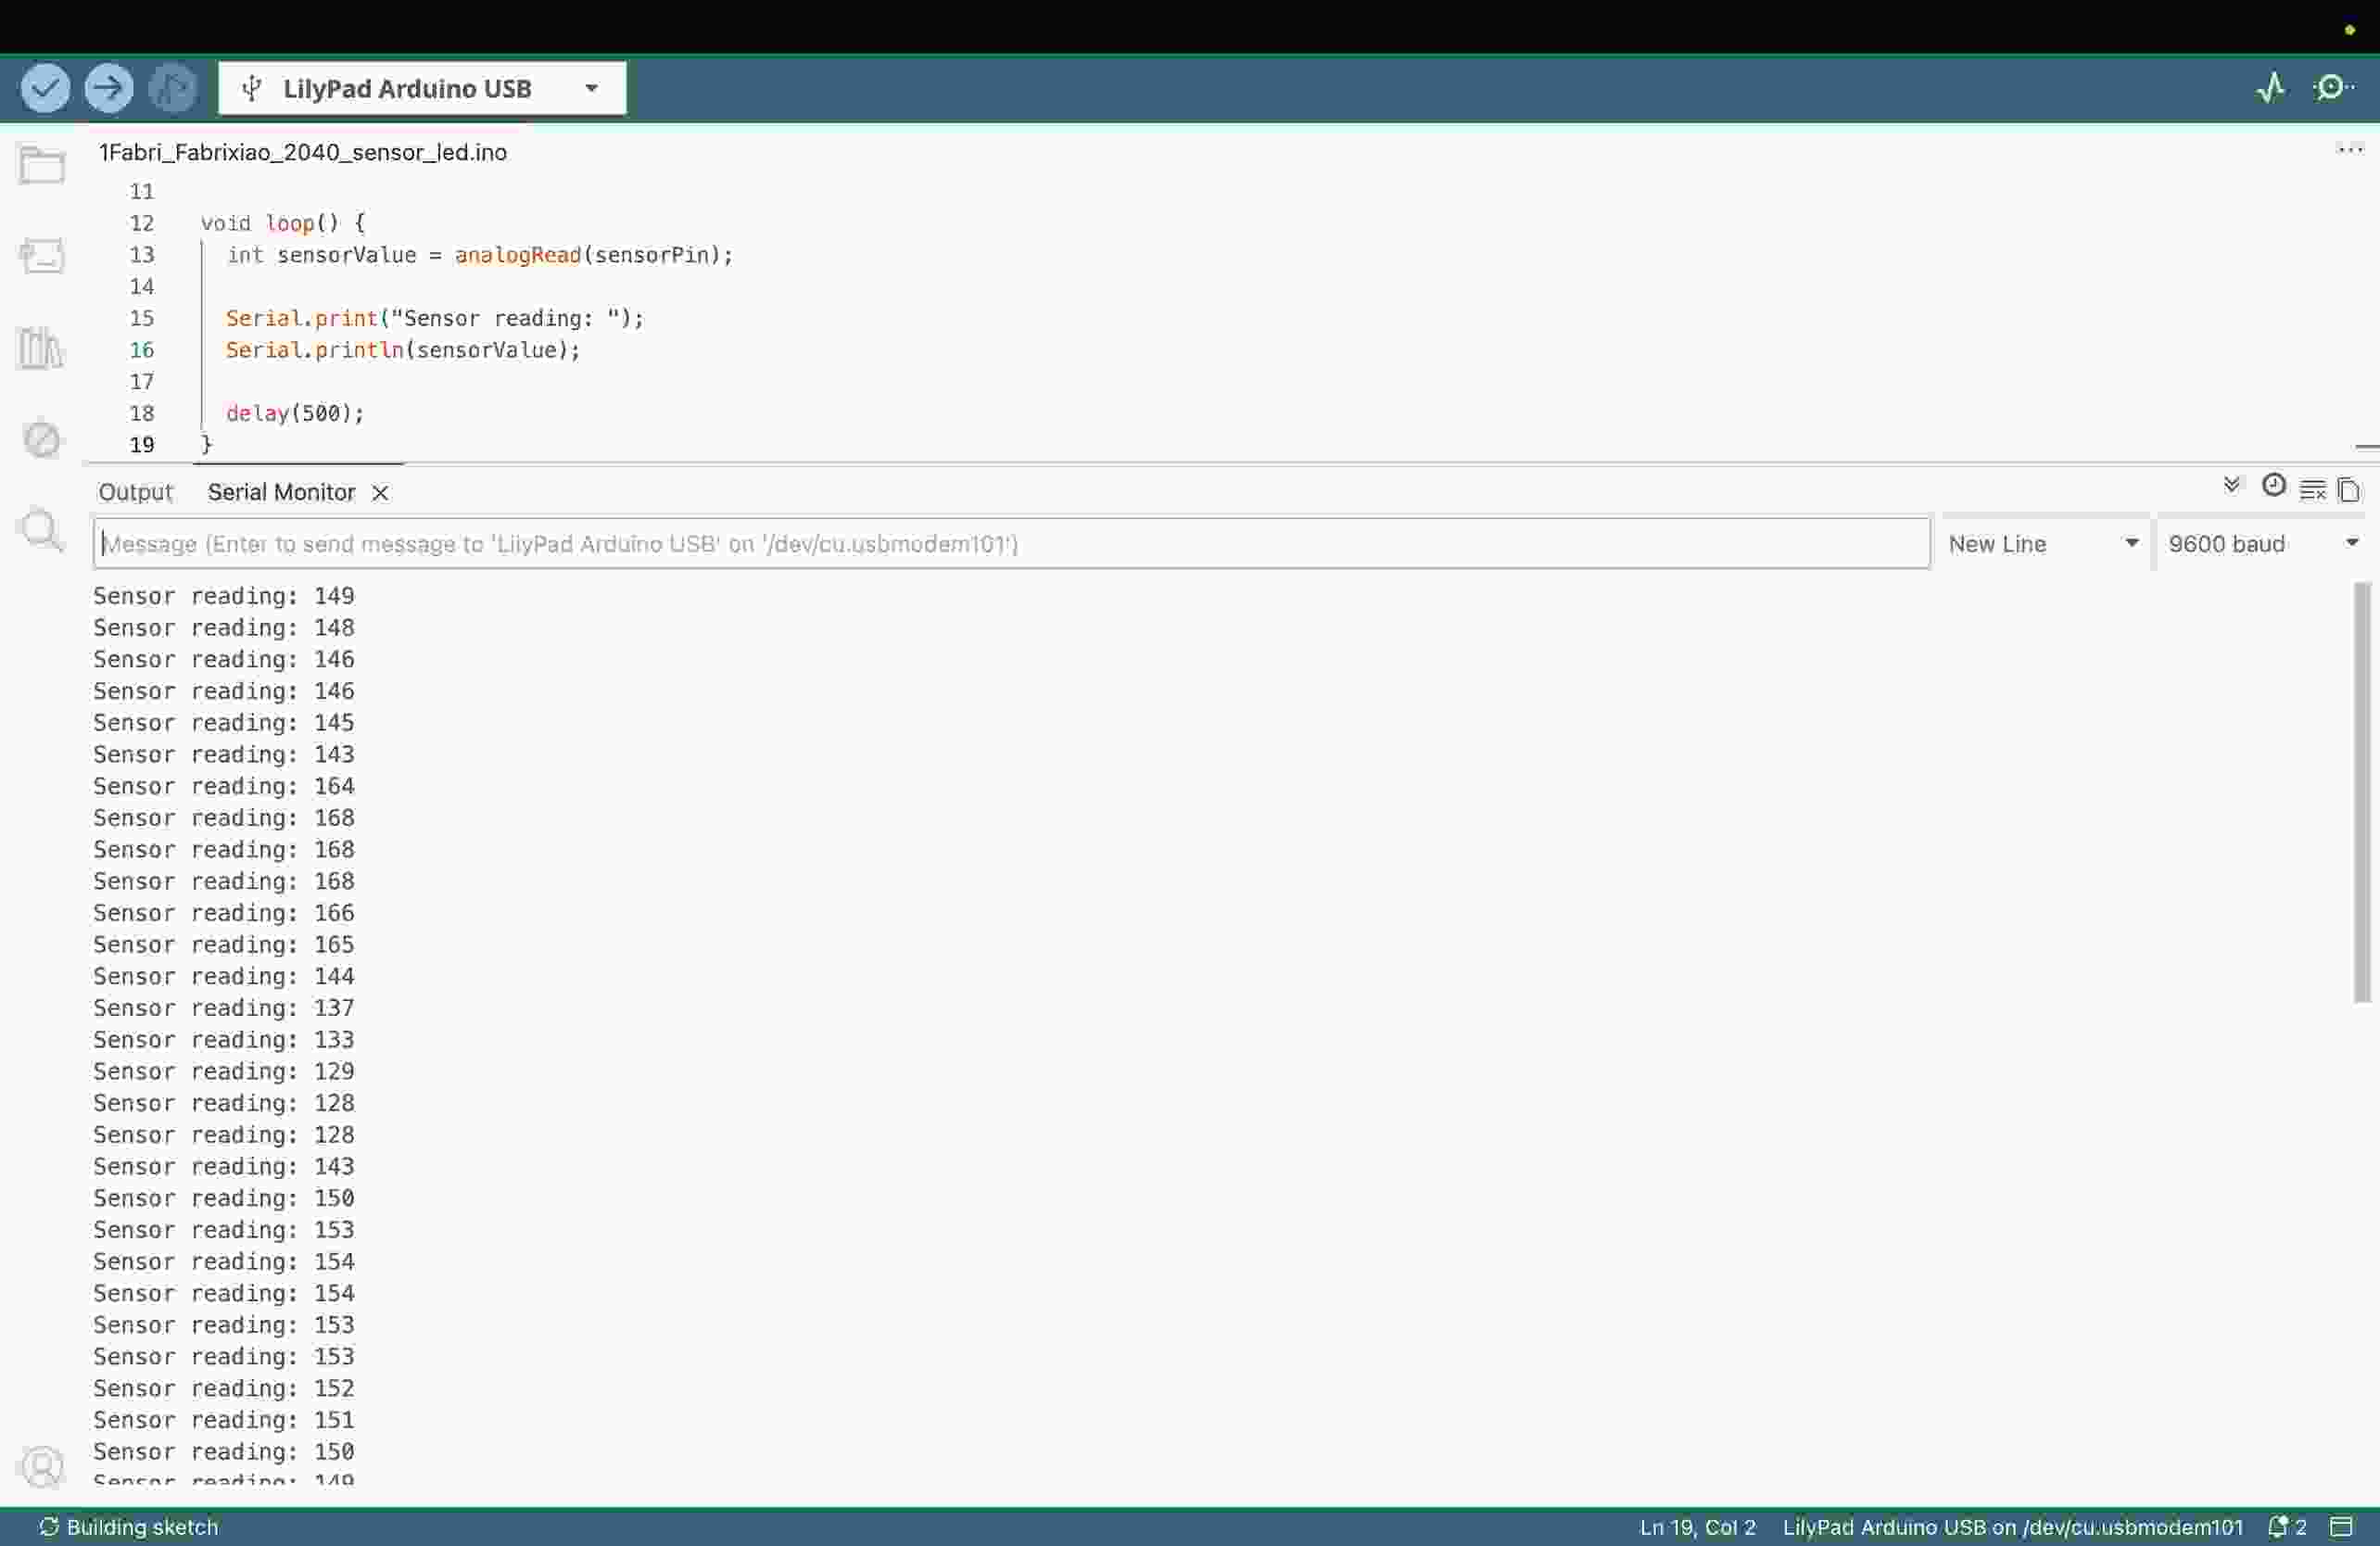
Figure. Arduino Serial Monitor showing changing analog pressure sensor readings from approximately 128 to 168
AnalogRead Pressure Sensor Test
Velostat Pressure Sensor Test
This code reads the Velostat pressure sensor connected to analog pin A9. The sensor values are displayed in the Arduino Serial Monitor at 9600 baud.
// Velostat Analog Pressure Sensor Test
// LilyPad ProtoSnap Plus

const int sensorPin = A9;

void setup() {
  Serial.begin(9600);
  delay(2000);

  Serial.println("Velostat Pressure Sensor Test");
}

void loop() {
  int sensorValue = analogRead(sensorPin);

  Serial.print("Sensor reading: ");
  Serial.println(sensorValue);

  delay(500);
}
Digital Soft Sensor
A digital soft sensor operates as a textile switch and produces two states: HIGH or LOW. Unlike the analog Velostat pressure sensor, which produces a range of values, the digital sensor identifies whether the soft switch is pressed or released.
Materials
- Foam
- Felt
- Aluminum foil
- Alligator clips
- LilyPad ProtoSnap Plus
- USB cable
- Arduino IDE
Building the Digital Soft Sensor
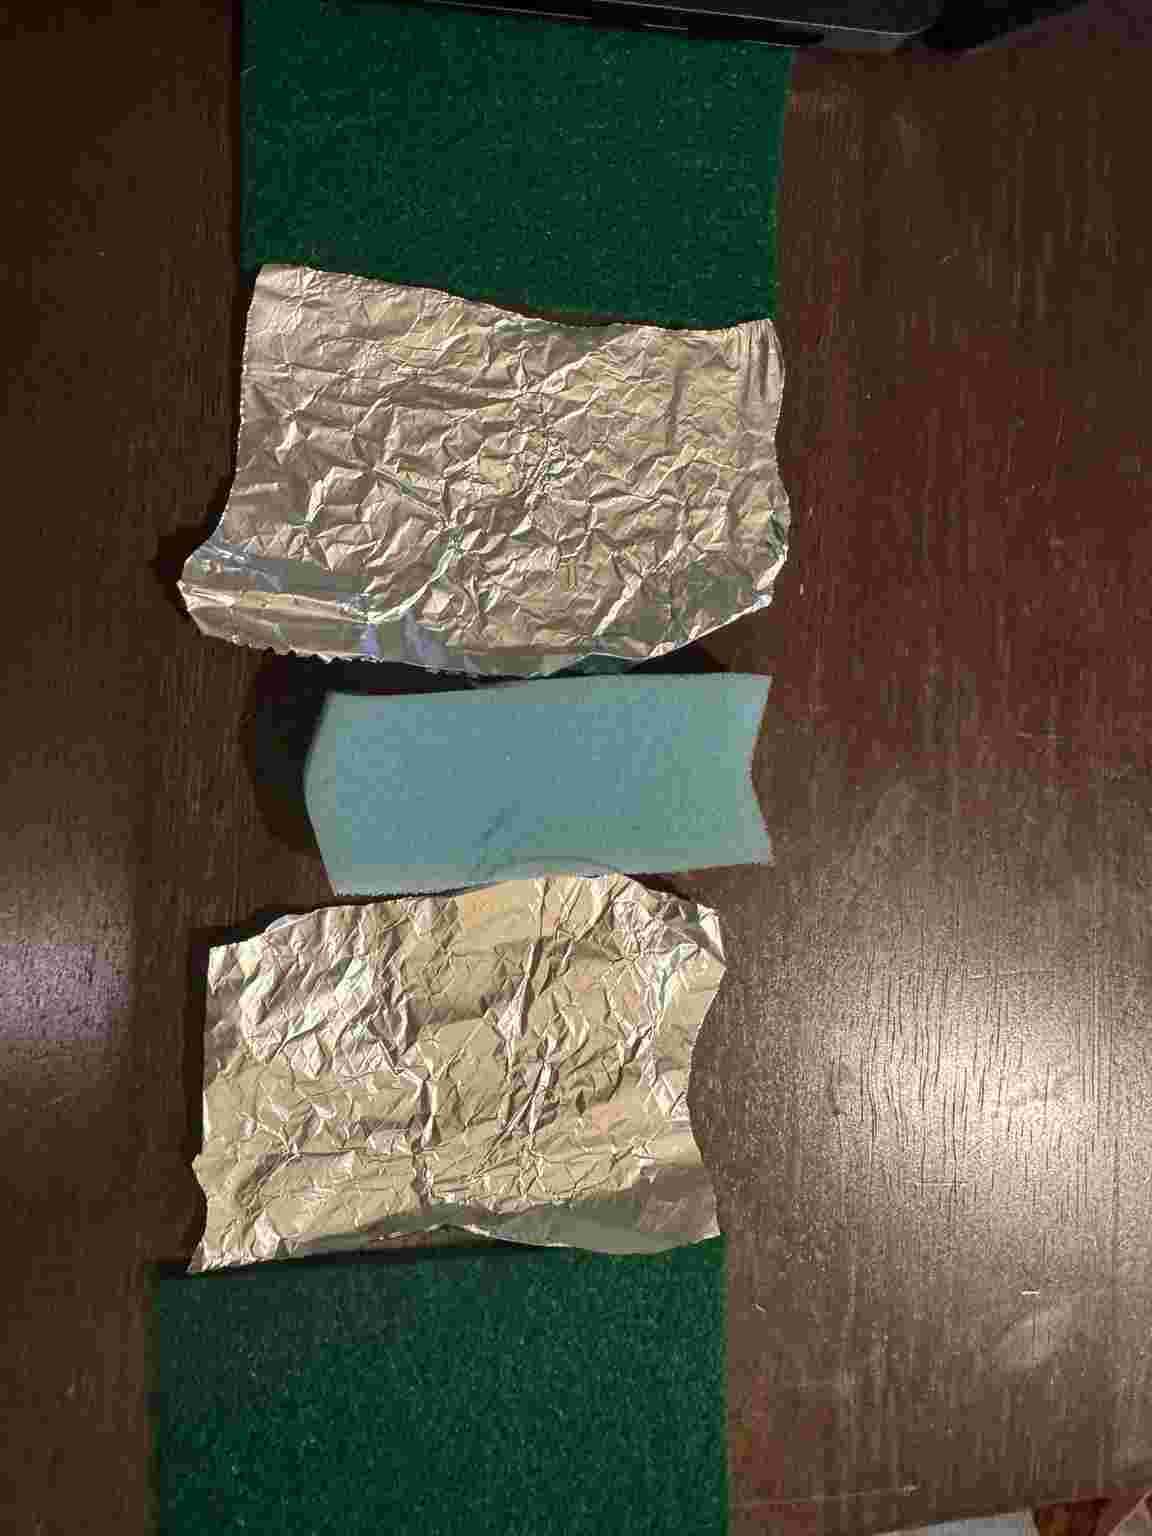
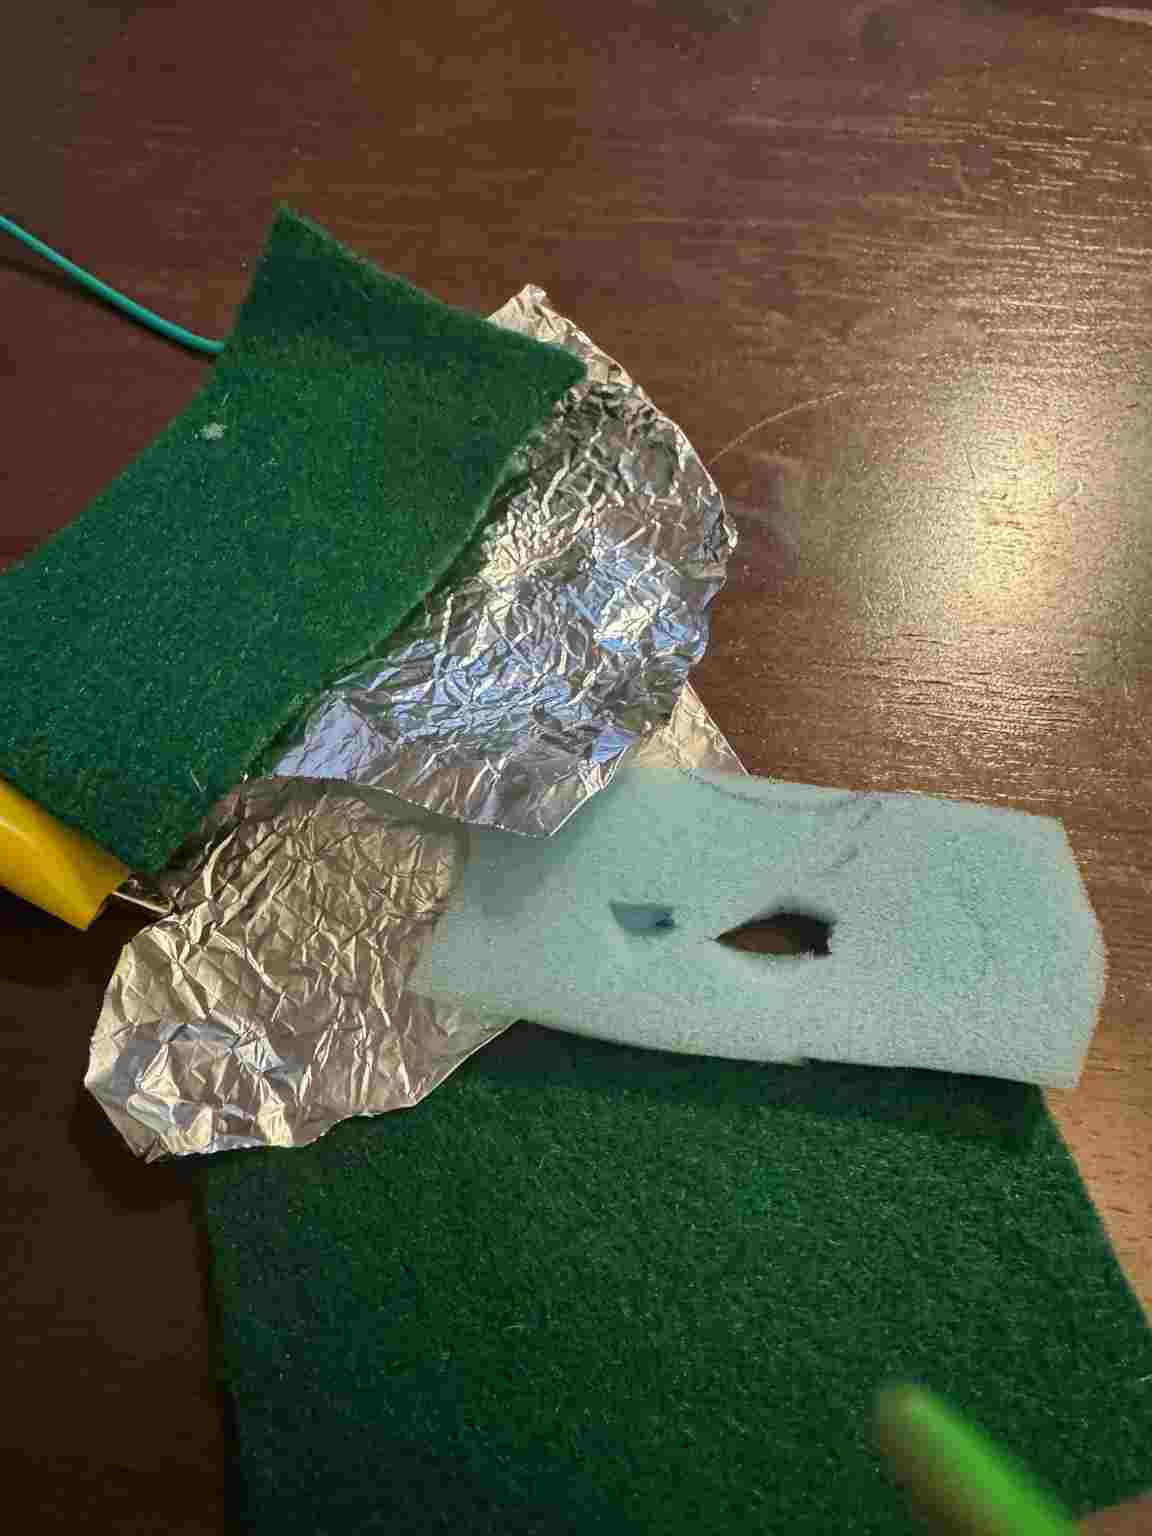
I created the digital soft sensor using two layers of aluminum foil separated by a foam spacer. Openings were cut into the foam to allow the conductive foil layers to make contact when pressure was applied.
The two conductive layers were connected to the LilyPad USB Plus. One layer was connected to digital pin 10, and the second layer was connected to ground (GND).
When the sensor was released, the conductive layers remained separated. When the sensor was pressed, the two conductive layers made contact and completed the circuit.
Digital Sensor Testing
The sensor was tested using the Arduino Serial Monitor at 9600 baud. The INPUT_PULLUP function was used to create a stable digital input.
When the sensor was released, the Serial Monitor displayed:
RELEASED - HIGH
When pressure was applied, the Serial Monitor displayed:
PRESSED - LOW
The successful change between HIGH and LOW confirmed that the handmade soft sensor functioned as a digital input that could be read by the LilyPad microcontroller.
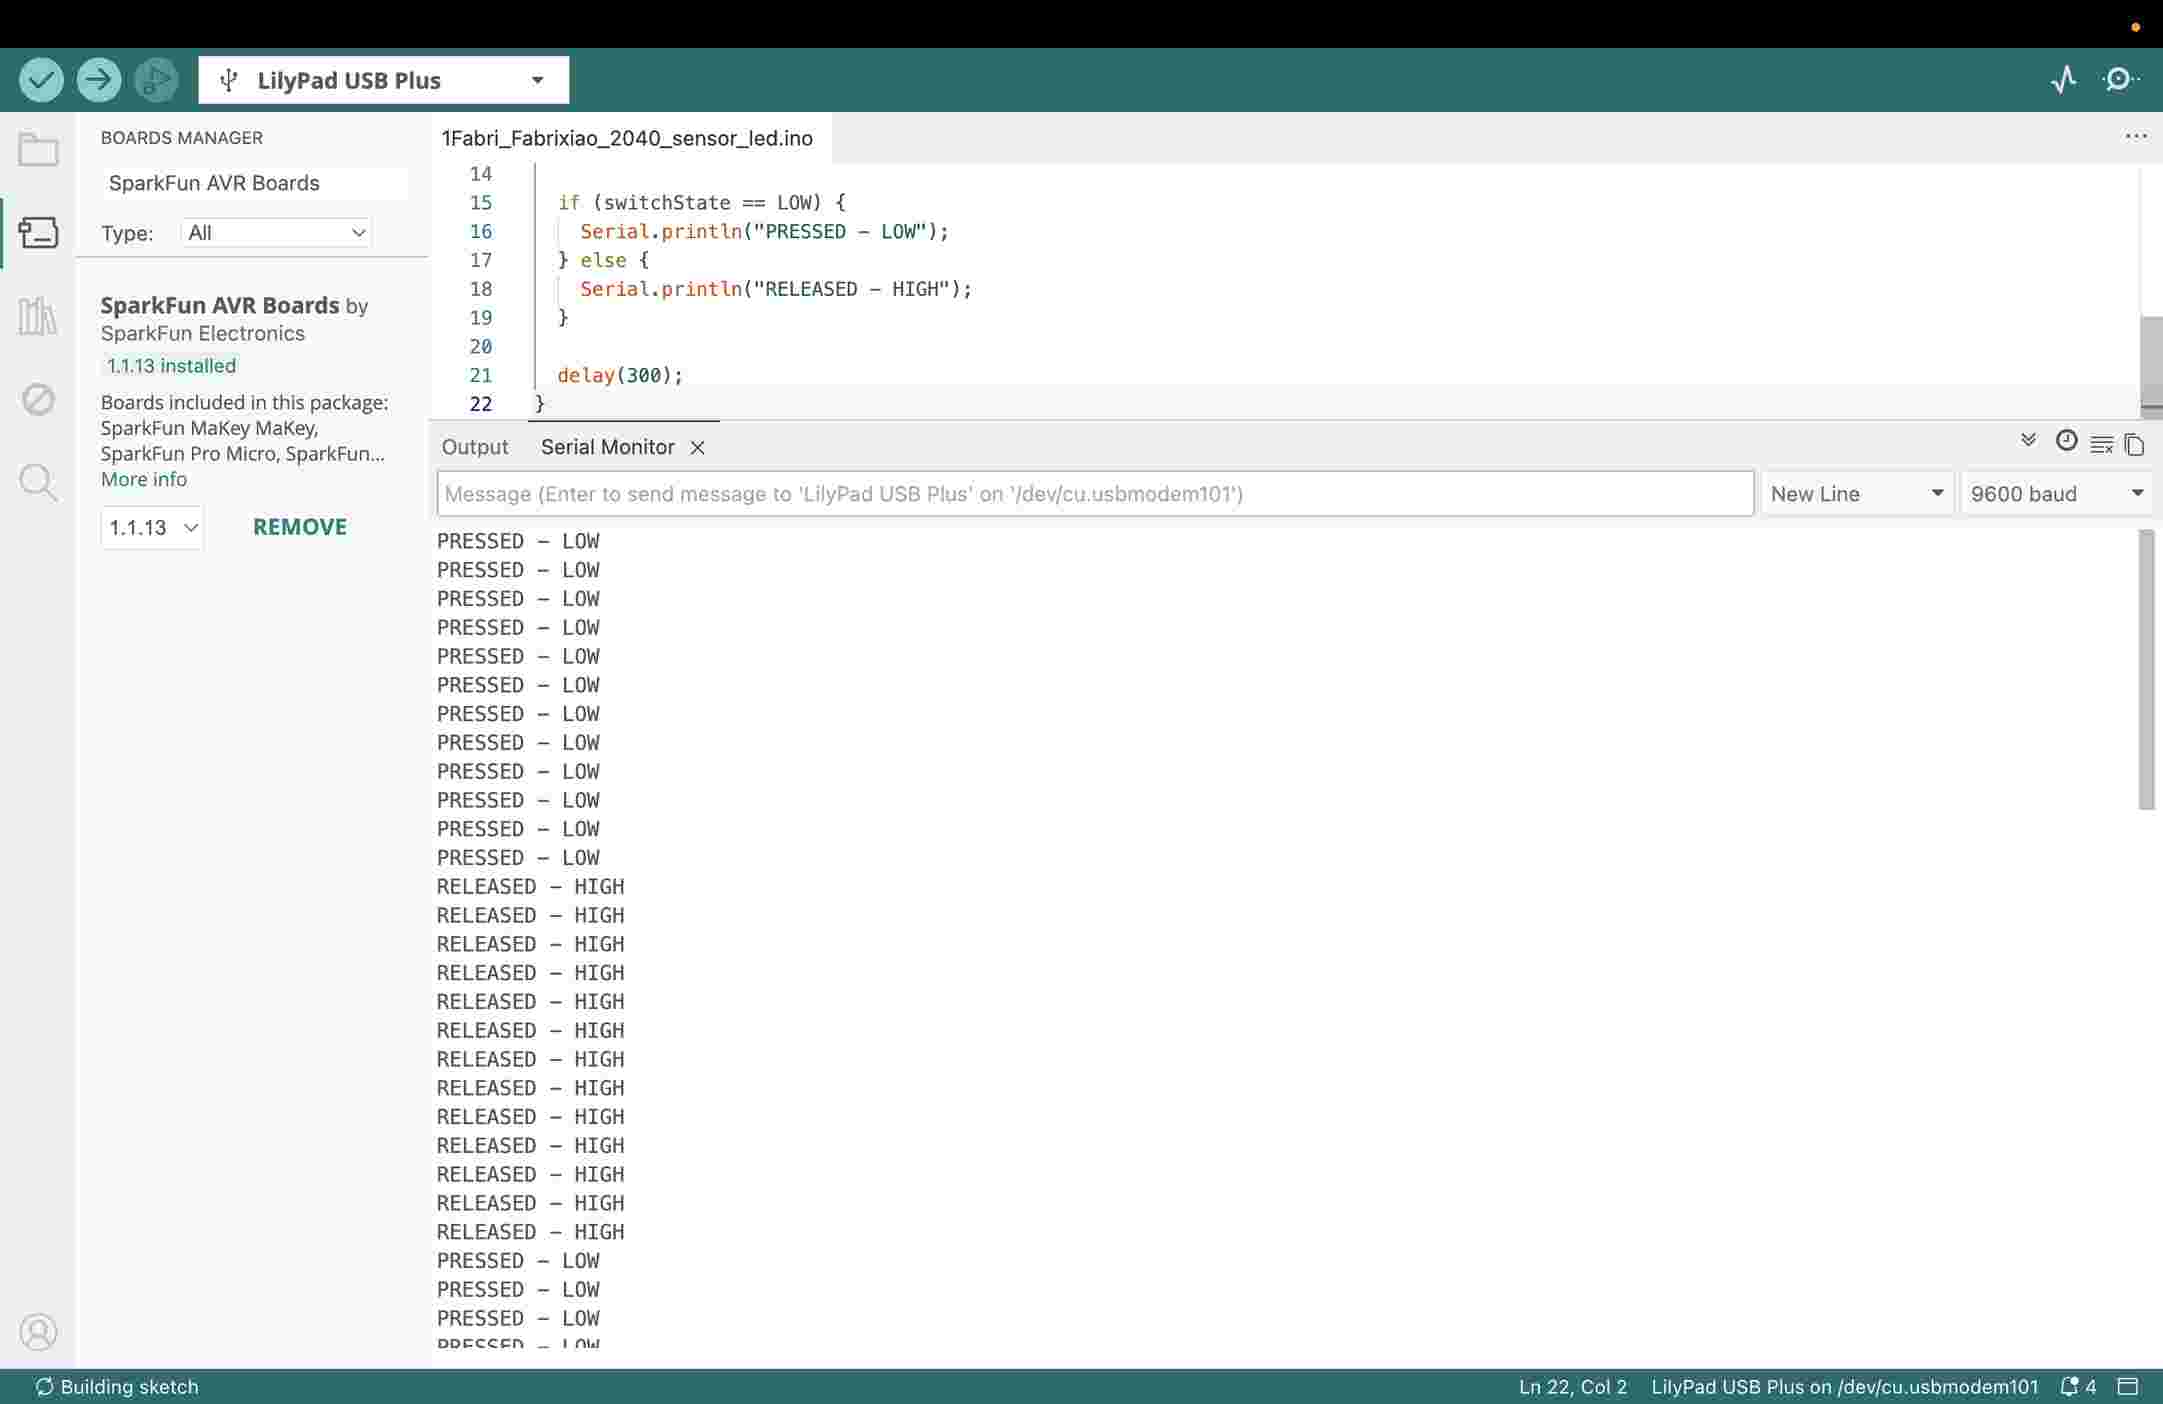
Figure. Arduino Serial Monitor showing the digital soft sensor changing between PRESSED – LOW and RELEASED – HIGH.
Digital Soft Sensor Arduino Code
The following Arduino sketch reads the soft textile switch connected to digital pin 10. The Serial Monitor displays the state of the sensor as either pressed or released.
// Digital Soft Textile Sensor
// LilyPad USB Plus

const int switchPin = 10;

void setup() {
  pinMode(switchPin, INPUT_PULLUP);

  Serial.begin(9600);
  delay(2000);

  Serial.println("Digital Soft Sensor Test");
}

void loop() {
  int switchState = digitalRead(switchPin);

  if (switchState == LOW) {
    Serial.println("PRESSED - LOW");
  } else {
    Serial.println("RELEASED - HIGH");
  }

  delay(300);
}
The digital sensor successfully produced two readable states. HIGH indicated that the sensor was released, while LOW indicated that the sensor was pressed.
Simple Soft LED Circuit Experiment
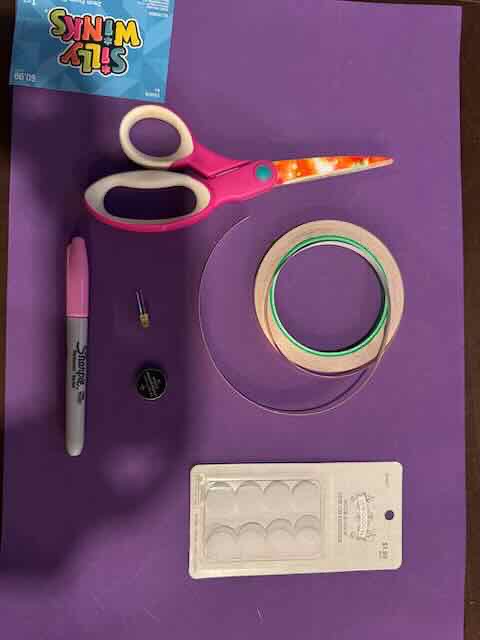
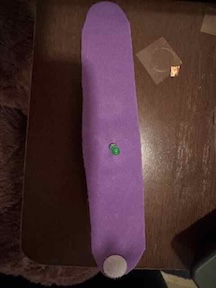
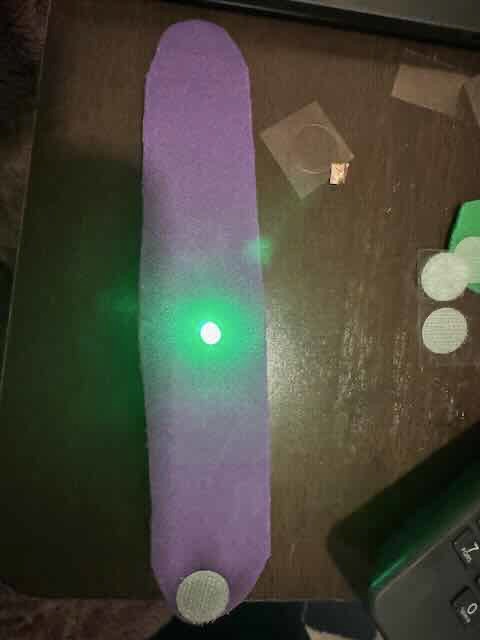
Before creating the digital soft sensor, I experimented with a simple soft LED circuit using foam, copper tape, an LED, and a coin cell battery. This was a passive circuit experiment and did not use a microcontroller or produce a digital HIGH/LOW signal. The experiment helped me understand conductive paths, polarity, and soft circuit construction before developing the microcontroller-readable digital sensor.
Materials
•   Foam strip
•   LED
•   Self-adhesive copper tape
•   3 V coin battery
•   Self-adhesive Velcro tabs
Build
- Cut a foam strip long and wide enough to fit comfortably around the wrist.
- Insert the LED through the foam and fold the leads flat against the back.
- Use copper tape and a small foam rectangle to form a battery pouch.
- Position the coin-cell battery so its positive and negative sides make contact with the corresponding LED leads.
- Add Velcro tabs to secure the battery pouch and close the bracelet.
- Insert the battery and test the circuit. The LED should illuminate when the circuit is complete.
Sensor Integration and Hard–Soft Connections
Final Integrated Plushie Code
This code combines the Velostat pressure sensor with the LilyPad and LED output. The LilyPad reads the pressure value and turns on the LED when the sensor passes the selected threshold.
Based on my pressure tests, I used a starting threshold of 150. This value may be adjusted depending on the final sensor readings.
// Final Integrated E-Textile Plushie
// Input: Velostat pressure sensor
// Microcontroller: LilyPad ProtoSnap Plus
// Output: LED

const int sensorPin = A9;
const int ledPin = A7;
const int pressureThreshold = 150;

void setup() {
  pinMode(ledPin, OUTPUT);

  Serial.begin(9600);
  delay(2000);

  Serial.println("Interactive Plushie Test");
}

void loop() {
  int sensorValue = analogRead(sensorPin);

  Serial.print("Sensor reading: ");
  Serial.println(sensorValue);

  if (sensorValue >= pressureThreshold) {
    digitalWrite(ledPin, HIGH);
  } else {
    digitalWrite(ledPin, LOW);
  }

  delay(200);
}
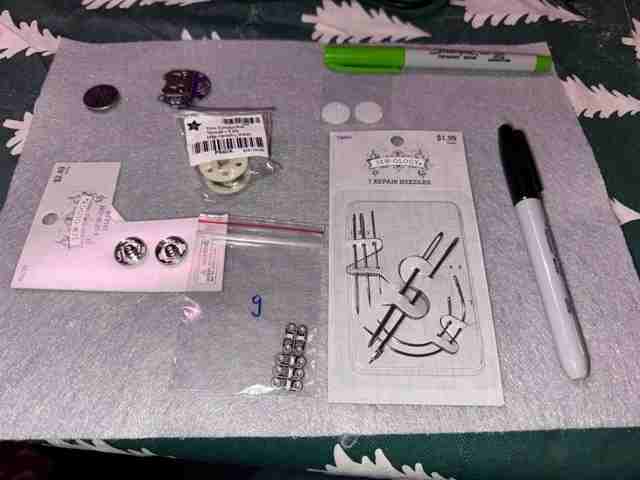
Integrating the Sensor Swatches
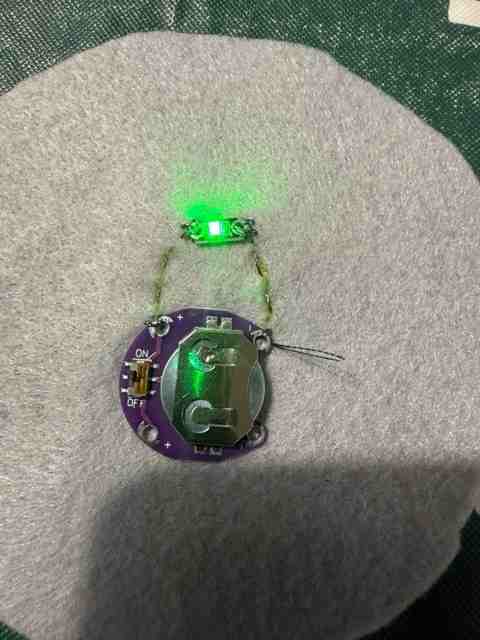
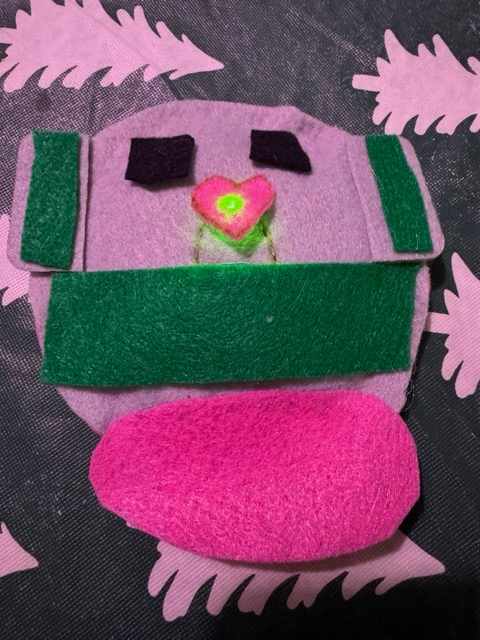
The analog and digital soft sensors were documented as two separate textile samples. The analog Velostat pressure sensor was integrated into the plushie, while the digital soft switch was developed and tested as a separate textile swatch. The analog Velostat pressure sensor was embedded within the felt structure of the plushie. When pressure was applied, the resistance of the Velostat changed and the LilyPad read the changing values using analogRead(). Based on my sensor tests, I selected a threshold value of 150. When the analog sensor reading reached or exceeded 150, the LilyPad activated the LED.
Input → Process → Output
- Input: Velostat analog pressure sensor
- Process: LilyPad reads the sensor value and compares it to a threshold of 150
- Output: LED turns on when the sensor reading reaches or exceeds the threshold
The digital soft sensor was constructed using two aluminum foil conductive layers separated by a foam spacer. The sensor was connected to the LilyPad USB Plus and tested using digitalRead(). When the conductive layers touched, the Arduino Serial Monitor displayed PRESSED – LOW. When the layers were separated, the Serial Monitor displayed RELEASED – HIGH. During prototyping, alligator clips were used as temporary hard–soft connections between the soft conductive materials and the rigid LilyPad microcontroller. In the plushie, conductive thread was used to connect the sewable electronic components to the textile structure. The conductive traces were kept separated to reduce the risk of short circuits.
Together, the two samples demonstrate different soft sensing techniques. The Velostat sensor produces a range of analog values, while the textile switch produces two digital states: HIGH and LOW. The final plushie was designed as a tactile companion for my daughter, Navy, with consideration for sensory comfort and grounding. It is intended to attach to her bookbag and provide a familiar tactile interaction throughout the school day.
Project Outcomes
Through this experiment, I created and tested two different soft sensors:
- Analog Soft Sensor: A Velostat pressure sensor that produced changing
analogRead()values of approximately 128–168. - Digital Soft Sensor: A handmade textile switch that produced HIGH and LOW states using
digitalRead(). - Textile Integration: The analog sensor was integrated into the plushie, while the digital sensor was developed as a separate textile swatch.
- Hard–Soft Connections: Alligator clips and conductive thread connected the soft conductive materials to the LilyPad microcontroller and electronic components.
- Circuit Documentation: Analog and digital circuit schematics were created and documented.
- Arduino Code: The analog sensor, digital sensor, and integrated plushie code is shown as editable text and provided as downloadable
.inofiles.
Arduino Code Files
- Download Velostat Pressure Sensor Code
- Download Digital Soft Sensor Code
- Download Integrated Plushie Code